Prometheus vs Grafana Monitoring Tools Comparison

Introduction to Monitoring Tools: Prometheus and Grafana
Within IT operations, surveillance is significant for maintaining seamless function of systems and applications. This surveillance process encompasses data compilation, manipulation, and examination, with the ultimate goal of identifying and rectifying issues before they morph into much larger concerns. To aid in this process, two avant-garde tools -- Prometheus and Grafana -- have gained significant traction amongst IT specialists and developers.
Both Prometheus and Grafana are freely accessible surveillance tools that deliver crucial insights into the performance of your systems and applications. Designed to navigate the intricacies of contemporary IT infrastructures, their extensive feature sets empower you with the necessary capabilities to undertake effective surveillance of your networks.
Prometheus, a hallmark project of the Cloud Native Computing Foundation (CNCF), operates as a systems and service surveillance system. At predetermined intervals, it accumulates metrics from established targets, estimates rule expressions, showcases the outcomes, and has the capability to initiate alerts if certain conditions are verified as true.
Conversely, Grafana functions as a multi-platform, open-source analytical and interactive visualization web-based application. It generates charts, graphs and web-based alerts when connected to approved data sources, making it the quintessential tool for data visualization.
Delving into Prometheus and Grafana
Prometheus' key functionality lies in its ability to monitor via metrics. It utilizes a time-series database for the storage of its data, and possesses a potent query language for data examination. The standout attribute of Prometheus is its multi-dimensional data model approach with time-series data, classified by metric name and key-value pairs.
Meanwhile, Grafana plays the role of a data visualization instrument that provides real-time insights into your data. A wide spectrum of data sources, including Prometheus, can be accessed by Grafana. It also provides a surplus of options for data visualization. Moreover, Grafana boasts a reliable alerting system, immediately signalling any data anomalies that hint at potential issues.
Interplay of Prometheus and Grafana
Both Prometheus and Grafana are influential in their own rights, but when used concurrently within the same surveillance stack they amplify their capabilities. Prometheus excels at collecting and preserving time-series data, however, it lacks in the data visualization department. Grafana steps in here, extracting data from Prometheus and generating visually pleasing, informative dashboards. The merger of these tools shapes a holistic solution for data acquisition and visualization, simplifying the task of effectively monitoring your systems and applications.
Core Distinctions
Unlike popular belief, these tools serve different surveillance intents despite being used in conjunction, and exhibit unique strengths. Prometheus primarily manages backend monitoring, which includes metrics accumulation and preservation. It's tailored to cater to the demanding data collection requirements of contemporary backend systems.
On the contrary, Grafana is fundamentally a visualization instrument. Its design focus rests on the ease of creating and disseminating dashboards, which are conglomerates of visualizations, metrics, and reports. Grafana's strength isn't just confined to visualizing Prometheus data; it can also visualize data from a plethora of other sources.
The subsequent sections will elaborate on each tool's unique attributes, virtues, setup procedures, data management, alert administration, scalability, performance, integration, additional plugins, and their utility in varied monitoring contexts. Additionally, we will evaluate their security attributes, pricing strategies, community assistance, and embed real-world usage in the form of a case study. This extensive comparison will equip you with the necessary knowledge to make an informed decision about which of these tools -- Prometheus or Grafana -- best fulfills your surveillance needs.
Understanding the Basics: What is Prometheus?
Prometheus garners respect as a remarkable, cost-efficient early warning solution and monitoring resource initially crafted by SoundCloud. It burst into the public eye in 2012, turning heads of many organizations due to its potent and adaptable characteristics. Notably, it finds wide application in cloud computing infrastructures, its chief duty being to provide alert and supervisory services.
Examining Prometheus More Closely
Prometheus challenges the established system of applications or underline system piping data to the observance centre. In contrast, it deploys a method termed as scraping scooping up metrics from predetermined targets at consistent intervals. This ‘fetch’ model is not just straightforward to set up but also entails the benefit of regulating load on the observation system.
Prometheus catalogs data as chronologically ordered records, comprising data points timestamped with their corresponding times from a similar metric and labelled dimensions. This architecture enables expedient and streamlined data inquiries and administration.
Salient Aspects of Prometheus
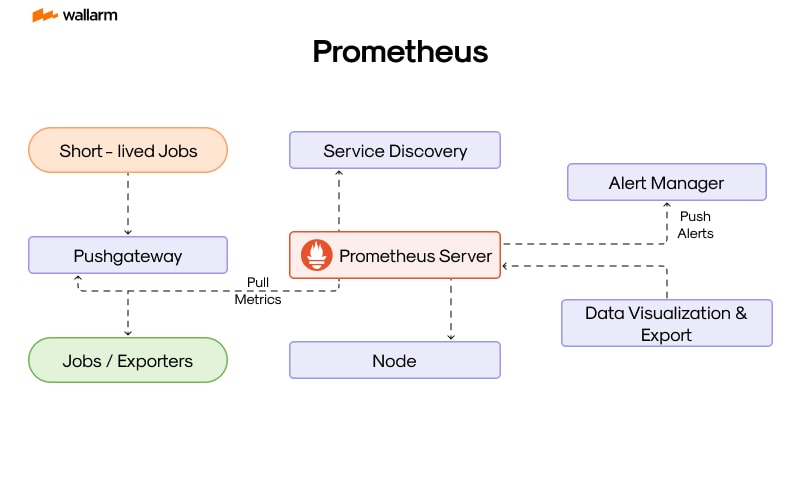
Prometheus encapsulates various important elements:
- Prometheus Server: This critical segment extracts and archives data structured as time series.
- Client Libraries: These enable application codes to assimilate the metrics offered by Prometheus.
- Push Gateway: This distinctive component handles transient tasks that are beyond the scope of scraping.
- Exporters: This functionality unveils metrics for utilities such as HAProxy, StatsD etc., that was not engineered by Prometheus.
- Alertmanager: An expert platform, used to direct alerts and ensure their deduplication, grouping, and delivery to the target recipient.
- Web UI: This function facilitates a visual display of the data housed in Prometheus.
Getting Acrross the Prometheus Data Model
Prometheus is equipped with an inventive data model that assigns an exclusive identification to every time-based record with a unique name and combination of key-value pairs, otherwise referred to as labels. The metric name and label unite to enable a multi-dimensional data model.
Let’s elucidate with a Prometheus metric instance:
In the above example, 'entries_logged_total' is the metric name while 'method' and 'handler' function as labels, offering additional data to the metric.
Datapoint Extraction using PromQL
PromQL, a formidable query dialect inbuilt into Prometheus, presents users with the capability to select and assimilate real-time data from multiple timescales. The results can be manifested visually, viewed through a tabular layout, or integrated into outward systems using its specific HTTP API.
Let’s elucidate with a data-extraction exemplar employing PromQL:
This inquiry computes the mean per-second pace of logged entries over the preceding 5-minute timeframe.
Armed with its robust data model and query mechanism, Prometheus serves as an exceptional asset for users angling to establish a thorough monitorin system. The fact that it is an open-source project backed by a motivated community further enhances its appeal. Nevertheless, it is paramount to comprehend that although Prometheus may excel in various scenarios, it might not be universally ideal and may not match every circumstance.
Diving Deeper: Comprehensive Look at Grafana
Grafana adeptly combines multifunctional web-based software capabilities to work across various platforms and streamline analytics, delivering resplendent visualization. It further specializes in a remarkable array of visual formats, ranging from diagrams to graphs. Its standout quality is its extensibility, brought to light through a unique plugin architecture that positions it as a prominent tool for log analysis.
Construct of Grafana
Grafana essentially operates on a client-server architecture. The server component, functioning on the backend, primarily deals with API response handling, security maintenance, and data source mediation. In contrast, the frontend is a web-based interface that communicates with the backend server, focusing on rendering data in an aesthetically pleasing format. The backend server, programmed in Go language, is contrasted by the frontend interface coded in JavaScript/TypeScript and powered by the React framework. This association contrives Grafana's platform independence, facilitating its functioning on any system that supports these programming languages.
Data Integration and Plugin Capabilities
Grafana displays compatibility with a variety of data sources such as Prometheus, InfluxDB, Elasticsearch, and Graphite, making it a highly adaptable platform suitable for various environments and a wide array of applications.
In addition, the platform boasts a remarkable plugin architecture that allows users to augment Grafana's core functionalities. This includes the addition of new data sources, creation of supplementary panels, application integration, and even the design of unique pages on the Grafana user interface. This aspect greatly enhances Grafana's multi-faceted utility as a data visualization tool.
Display and Dashboard Features
At the heart of Grafana lies its exceptional data display capabilities. It equips users with the flexibility to create dashboards incorporated with sections that can depict data from multiple sources in multiple formats. Grafana doesn't just limit itself to graphs, tables, heatmaps, and single statistics; it broadens the array of presentation.
Grafana further bolsters its user interface by endorsing templating, which allows users to craft dynamic and reusable dashboards. Variables work as placeholders in queries, panel titles, etc., interactively adjustable by the user.
Alert Notifications
A key feature of Grafana includes a hardy alert notification system. Users can designate alert rules for their data sources, and Grafana continually scrutinizes these guidelines vis-à-vis the incoming data flow. If the alert conditions are met, Grafana holds the capacity to distribute notifications via multiple channels ranging from email to Slack, PagerDuty, and others.
Security Measures
Prioritizing security, Grafana deploys advanced features such as data source proxying. This process routes all data source requests through the Grafana server, eliminating the need for direct browser-based requests by users. And that's not all; it upholds stringent security via secure cookies, HTTPS, amongst other features zeroed-in on data safety.
In conclusion, Grafana is an efficacious, adaptable, and fully secure platform for data rendering and monitoring. It's seamless amalgamation with several data sources, expandable plugin architecture, robust alerting mechanisms, and a firm focus on security all converge to position Grafana as a formidable player in the fields of monitoring and data visualization.
Prometheus vs Grafana: The Core Differences
Specific Responsibilities and Attributes
Prometheus is basically a tool designed for both monitoring purposes and functioning as a type of database for time-series data. Its primary advantage is its capability to continually collect and preserve relevant data from monitored sources at predetermined periods, and to send immediate alerts when certain parameters are met. It has gained traction as a preferred monitoring tool within microservice-based systems, primarily because of its ability to process multidimensional data, and its highly customizable query language.
On the other hand, Grafana is primarily recognized as a facility for visual representation of metrics over time. It's capable of amalgamating data from differing sources, Prometheus included. Yet, its inherent strength lies not in data collection or preservation, but in its graphical portrayal of data.
Handling and Safekeeping of Data
Prometheus employs a pull technique for data collection, extracting from monitored entities at specified cycles. This strategy facilitates Prometheus to work within distributed systems and handle incidental inability to access targets. The data it collects remains safeguarded within the boundaries of Prometheus.
Grafana, however, does not engage in data collection or retention. It instead relies on data sources, Prometheus being one of many, for data supply. Using this data, Grafana repurposes it to graphical representations that are not just visually pleasing but easily understood.
Language for Queries
Prometheus comes with a unique language for queries, known as PromQL, which is committed to the selection and aggregation of time-series data in real-time scenarios. Offering both potency and flexibility, PromQL allows users to modify data as needed.
In contrast to Prometheus, Grafana doesn’t feature a dedicated language for queries. Instead, it utilizes the query language of the data source it connects to. For example, when connected with Prometheus, Grafana makes use of PromQL.
Alert Management
Prometheus incorporates a built-in alert management system, termed the Alertmanager. This component manages alerts generated by client applications, like Prometheus' server, dealing with deduplication, sorting, and effecting redirections to relevant recipients such as email, PagerDuty, or OpsGenie.
Although Grafana also offers alert features, its main focus is on the visualization of alerts. Alerts in Grafana can be displayed on panels and can be customized to send notifications across multiple channels.
Compatibility
Prometheus is engineered with a wide array of service discovery options and can monitor multiple services without any modifications. It can also seamlessly integrate into various systems, including Grafana.
Contrarily, Grafana is architected to connect with many data sources, one of them being Prometheus. This flexible nature of Grafana positions it as a preferred tool for data representation.
In conclusion, Prometheus and Grafana, despite some overlapping features, are distinct in their respective specializations. Prometheus is a formidable tool for monitoring and alert generation, while Grafana excels as a versatile platform for visual representation of data. Their combined utilization leads to a comprehensive monitoring solution.
Prometheus: Key Features and Benefits
Prometheus has carved a special place in the hearts of many tech aficionados due to its broad array of specific capacities and attributes. Being born out of SoundCloud and eventually coming under the administration of the Cloud Native Computing Foundation, this system provides time-series databases along with monitoring abilities.
Comprehensive Surveillance and Proactive Alerts
In the vast field of system surveillance, Prometheus raises the bar with its encompassing capabilities, extending beyond mere servers, databases or applications. The software efficiently collects critical figures by conducting checks on HTTP endpoints located in supervised subjects, enhancing its usefulness in scrutinizing microservices, containers, and the entire infrastructure.
Its sophisticated alert mechanism allows the users to formulate distinct rules for metric alerts and get notified once the prerequisites are fulfilled. Such features facilitate rapid identification and prompt resolution of system snags.
Varied Dimension Data Modeling and Exclusive Query Language
Prometheus utilises a varied dimension data model where the time-series figures are dictated by the metric label and key/value pairs, ensuring high efficiency in event and object cardinality.
The system's own query dialect, named PromQL, leverages this data model to its fullest. PromQL aids users in selecting and merging time-series figures swiftly, facilitating broader understanding of data, courtesy of these robust querying functionalities.
Independent Server Nodes
Prometheus takes pride in its fail-proof architecture where each server node operates independently, negating the need for network storage or corresponding services. This feature ensures unwavering and trustworthy data collection and storage, even in events of network disruptions or collapse.
Superior Performance Storage
The software possesses a custom-made storage system designed for time-series data. It safeguards data for an extended period with reliable solutions for their preservation and recuperation. The storage abilities of Prometheus make it suitable for long-term monitoring needs.
Collaborative Abilities and Repository Resources
Prometheus offers plentiful client repositories to enhance user coding experience. Supporting over ten languages such as Java, Go, and Python, this framework integrates smoothly into your established infrastructure.
It extends backing for service discovery or unchanging target configuration for data collection, even being compatible with favourite service discovery systems including Kubernetes and Consul.
Data Portrayal
Although Prometheus includes a built-in expression viewer for data depiction, it aligns well with Grafana, a renowned data visualisation tool that aids users in creating detailed dashboards, augmenting user knowledge of the data.
Reasons to Opt for Prometheus?
Other than being a largely community-driven, open-source platform, Prometheus presents a host of advantages that make it an appealing choice for monitoring needs:
- Open-source and Community-driven: Being open-source, Prometheus invites global developers to use and upgrade its capabilities.
- Sturdiness and Dependability: With its autonomous server nodes and robust storage system, Prometheus promises reliability.
- In-depth Query Capabilities: PromQL aids in deriving significant data insights.
- Broad Integration Options: Numerous client libraries and service discovery alternatives from Prometheus facilitate seamless blending with your current infrastructure.
- Flexible Alerting System: The versatile alerting techniques in Prometheus help in quickly recognizing and resolving system issues.
In summary, Prometheus is a powerful, steadfast, and flexible solution for surveillance needs with its mix of diverse features and multiple advantages, making it the first choice for businesses looking to implement a holistic monitoring system.
Grafana: Its Capabilities and Strengths
Holding its own as a free resource for complex data illustration, Grafana is celebrated for its multi-faceted compatibility with numerous data storage solutions like Prometheus, Graphite, InfluxDB, and Elasticsearch. It is a favored tool offering adaptable and in-depth analytics alternatives.
Grafana: An Overview
Grafana's strength lies in its enhanced illustrative abilities. With a wide variety of visual representation options like chronological sequences, segmented circles, intensity graphs, and horizontal comparisons, it delivers a flexible route to present data.
Dynamic Data Representation
Essentially, Grafana is a dynamic platform for in-depth data reflection. It offers an array of pictorial depictions, inviting users to indulge in personalized data investigation through graph designs. The tool is like an artboard for those searching to inject some visual variety into their data.
Instantaneous Alerts
Grafana's continuous monitoring element grants you an edge when it comes to critical measures. Its integrated warning system facilitates setting up notifications that trigger instantly based on pre-determined data states, ensuring quick message dissemination via several channels like email or Slack, hence making unexpected anomalies manageable.
Customizable Dashboards
One of Grafana's key virtues is in its customizable dashboards capability. With this function, users can craft dashboards that extract data from multiple resources. Colleagues can share these tailor-made dashboards, fostering comfortable collaboration and info-swapping.
What Sets Grafana Apart
Grafana's charm goes beyond its main features. The fact that it is a free tool attracts users and developers from diverse specialties, encourages ongoing progress, and ensures that its interface caters to a broad range of technical skills.
Vibrant User Base
Grafana takes pride in its dynamic user base, who consistently assist in enhancing existing features and developing new ones. This lively hub provides various helpers like all-inclusive guides, sequential instructions, and engaging discussions to take full advantage of Grafana.
User-Friendly Interface
Grafana's interface revolves around keeping things simple. It makes navigating through data, crafting dashboards, setting up warnings, and understanding data a breeze even for those who are new to data mechanics. The simplicity of this tool speaks volumes when less technical individuals engage with data analytics.
Expandability
Grafana's scope for enlargement is unparalleled. With an integrated extension system, users can incorporate new data storage solutions, visual panels, and a vast range of features as needed. This adaptable nature readies Grafana to handle innumerable scenarios with ease.
In summary, Grafana has established itself as a reliable, all-around tool for data analytics and supervision. Its rare combination of essential benefits backed by its community-led growth, clear-cut interface, and easy expansion capabilities make it an invaluable tool for anyone exploring their intricate data.
Setting Up Prometheus: A Step-by-Step Guide
Setting up Prometheus involves a series of steps that are easy to follow. This guide will take you through the process, from downloading the software to configuring it for your specific needs.
Step 1: Downloading Prometheus
The first step in setting up Prometheus is to download the software. You can do this by visiting the official Prometheus website and navigating to the download page. Here, you will find versions of Prometheus for various operating systems, including Windows, MacOS, and Linux. Choose the version that corresponds to your operating system and download it.
Step 2: Extracting the Files
Once you have downloaded Prometheus, the next step is to extract the files. If you are using a Unix-based operating system like Linux or MacOS, you can do this using the tar command in the terminal.
Step 3: Configuring Prometheus
After extracting the files, you will need to configure Prometheus to suit your needs. This involves editing the prometheus.yml file, which is the main configuration file for Prometheus.
In this file, you can specify the targets that Prometheus should monitor, the intervals at which it should scrape these targets, and other settings.
In this example, Prometheus is set to scrape metrics from itself (localhost:9090) every 15 seconds.
Step 4: Running Prometheus
Once you have configured Prometheus, you can start running it. Navigate to the directory where you extracted the Prometheus files and run the following command:
Prometheus should now be running and scraping metrics according to the configuration you specified.
Step 5: Accessing the Prometheus Web Interface
After starting Prometheus, you can access its web interface by opening a web browser and navigating to http://localhost:9090. Here, you can view the metrics that Prometheus is scraping, create and test PromQL queries, and more.
Step 6: Setting Up Alerting Rules
Prometheus allows you to set up alerting rules that trigger when certain conditions are met. These rules are defined in a separate file, which you can specify in the prometheus.yml configuration file.
In this example, an alert is triggered if the mean request latency for the job "myjob" exceeds 0.5 seconds for more than 10 minutes.
By following these steps, you can set up Prometheus and start monitoring your systems. Remember that Prometheus is highly configurable, so you can tweak the settings to suit your specific needs.
The Installation Process: How to Set Up Grafana
In order to harness the power of Grafana for your data visualization needs, you must take several critical steps. This includes procuring the software, initiating the setup on your device and aligning Grafana's features to your preferred specifications. This manual covers the specifics, giving you all the tools you need for a seamless Grafana installation.
Procuring Grafana
Kickstarting your Grafana journey begins with acquiring the software. Grafana supports a multitude of platforms like Windows, macOS, and Linux. Ensure you download the version that aligns with your device's OS from the Grafana site.
Ensure to follow the below steps:
- Navigate to Grafana's download web page.
- Pick the software version compatible with your device's OS.
- Select the 'Download' link.
- Save the downloaded file to your device.
Initiating Grafana Setup
Having secured the file, it's time to initiate the installation. The setup process aligns with your OS.
Windows Setup Procedure
For Windows users, play it out this way:
- Find the downloaded file and double-click on it to initiate setup.
- Pay attention to the prompts in the setup dialogue box.
- Pick your preferred location for the setup.
- Initiate the setup process by clicking on 'Install'.
Linux Setup Procedure
For Linux users, the setup occurs via the terminal. Just follow these steps:
- Launch your terminal.
- Take the terminal to the directory where you downloaded Grafana.
- Implement the command to set up Grafana:
sudo dpkg -i grafana_<version>_amd64.deb - Wait for the command to finish executing.
Aligning Grafana to Your Specifications
Post-installation involves configuring Grafana. This encompasses initiating the Grafana server, integrating it with a database, and personalizing the web server.
Initiating the Grafana Server
Follow these steps to get the Grafana server running:
- Locate and open the Grafana configuration file. It's usually located at
/etc/grafana/grafana.ini. - Edit the
[server]section. Set thehttp_portto your preferred value (default is 3000) and designate a name to your Grafana server underdomain. - Save and close the edited file.
Integration With the Database
Grafana's default data storage is SQLite. However, you can reconfigure it to use MySQL or Postgres. Follow these steps:
- Open the Grafana configuration file in your text editor.
- In the
[database]section, specify thetypeof database, itshost,name,user, andpassword. - After making the changes, close and save the file.
Customizing the Web Server
Lastly, you need to configure the web server. Follow these steps:
- Open the Grafana configuration file in your text editor.
- In the
[server]section, specify theprotocol,http_addr, andhttp_port. - After making the changes, close and save the file.
Once you've completed these configurations, the Grafana server should be ready for use. Use this command to start the server: sudo service grafana-server start.
In summary, the process of setting up Grafana involves three key steps: obtaining the software, initiating setup, and customizing the software's specifications. This guide breaks down these steps, making the process feasible even for beginners in the field. Now that Grafana is up and running, you can dive into visualizing and monitoring your data.
Prometheus and Grafana: How They Handle Data
Within the arena of data tracking and visualization, two potent tools have risen to prominence - Prometheus and Grafana. Each tool boasts special abilities in controlling data due to their unique methodologies. Below, we delve into their distinct strategies for handling data.
Examining Prometheus: The Data Collection Technique
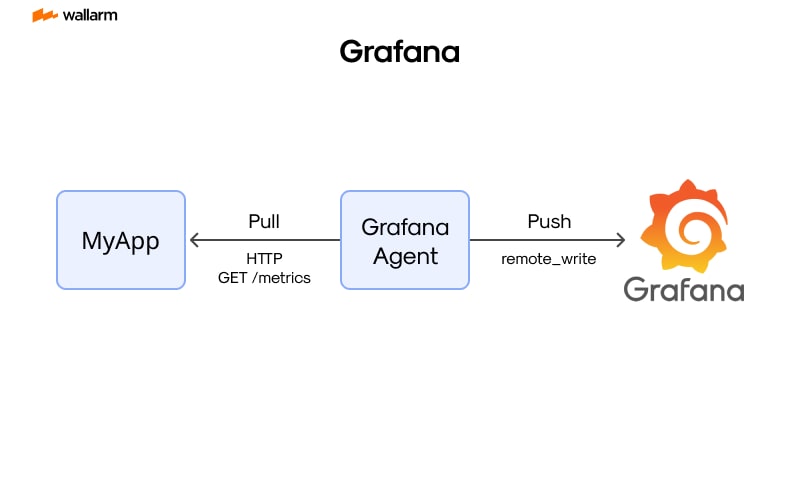
Prometheus profits from a data collection technique where it actively seeks or "fetches" metrics data from the systems it monitors. These examined systems make their metrics available at an HTTP endpoint, and Prometheus harvests this data routinely.
This model comes with several advantages. It discards the necessity for a separate push gateway, simplifying the architecture. Moreover, it provides precise control over the frequency of data gathering, reducing the chance of overburdening the monitoring system with surplus data.
Nonetheless, this collection technique has some caveats. The systems being monitored have to be consistently reachable. In case a system becomes unreachable, Prometheus cannot fetch its data.
Here is an uncomplicated illustration of configuring Prometheus for data collection:
Shedding Light on Grafana: The Ace of Visualization
On the other hand, Grafana does not accumulate data. Instead, it serves as a visual maestro, transforming data into a legible format by presenting it in a user-appealing style. Grafana can exchange information with multiple varied data sources, including Prometheus, and fetch data for demonstration purposes.
Grafana excels at crafting interactive, compelling dashboards. These dashboards can incorporate multiple panels, each exhibiting a different metric or cluster of metrics. Grafana's adaptability lets users mould these panels to their liking, employing the Grafana query language to sift and modify data.
Here is a standard setup for a Grafana dashboard:
Data Management Duel: Prometheus vs. Grafana
In closing, whilst Prometheus and Grafana do regulate data, they do it distinctly and for different ends. Primarily, Prometheus operates as a monitoring instrument that amasses and stores data. Conversely, Grafana is a visual maestro projecting the data in an appealing and user-focused approach. The choice between the two relies on your individual requirements and stipulations.
Visualizing Data: UI Comparison between Prometheus and Grafana
Both Prometheus and Grafana serve as useful tools for representing data visually. To select the tool that caters to your utilitarian requirements, appreciating the diversities in the user interfaces of both tools is necessary.
Prometheus: Uncomplicated and Purposeful
Prometheus's user interface (UI) is fluid and uncomplicated. It is designed to empower users to probe their data metrics with ease and precision. The primary screen of Prometheus's UI features a minimalistic text box, wherein users can formulate their inquiries using PromQL - a potent query language specific to Prometheus.
By virtue of these inquiries, outcomes are manifested in a rudimentary graph structure. Users have the flexibility to modify the time span of the graph. The presented data can be analyzed either as a graph or in the tabular form. Although the graph configuration in Prometheus is quite straightforward, it more than meets the requirements of a variety of monitoring tasks.
An illustration of a basic PromQL probe could be as follows:
This probe yields the aggregate count of HTTP requests to the "/api/comments" handler for the job termed "apiserver". The subsequent graph enumerates the frequency of these requests in a defined timeframe.
Grafana: Sophisticated Display and Adaptability
In contrast, the UI of Grafana offers users an intricate and highly adaptable platform for data visualization. Grafana's user interface is engineered to be instinctive and welcoming, supporting a bounty of data representation choices. Users have the luxury to design personalized dashboards encompassing multiple panels, each panel displaying distinct sets of data metrics in numerous forms.
Grafana affords users a multitude of options in terms of graph types, including but not limited to linear graphs, bar graphs, pie charts, and heatmaps, which can be tailored to include options such as color themes, axis labels, and graph legends. What's more, Grafana facilitates annotations, allowing users to highlight key points on the graph using notations or remarks.
Here's a scenario involving Grafana dashboard configuration:
This configuration conceives a dashboard with a dual-panel display: one graph representing HTTP requests to the "/api/comments" handler of the "apiserver" job, and another expressing a singular statistic marking the error rate relative to all HTTP requests generating a 5xx status code.
Contrastive Evaluation
Summarizing, though Prometheus furnishes a convenient and straightforward UI for probing and visualizing data metrics, Grafana enables a superior, customizable user experience. Your choice hinges on your functional requirements and discretion. If you harbor the need for superior visualization adaptability and personalizable dashboards, Grafana becomes an obvious choice. On the other hand, if you appreciate a simple, purposeful methodology, Prometheus may fulfill your requirements better.
Alert Management: How Prometheus and Grafana Compare
Alert handling is a key function of any monitoring solution, serving as an essential alert system for notifying users of any inconsistencies or problem areas that require immediate resolution. Prometheus and Grafana, both are efficient at prompt alerting, but their methodologies vary in practice.
Prometheus has an inherent alerting mechanism named Alertmanager, which effectively manages alert notifications dispatched by client interfaces such as the Prometheus server. The Alertmanager is responsible for eradicating duplicates, classifying and routing these alerts to the appropriate receiver such as email, PagerDuty, or OpsGenie. Furthermore, Alertmanager is capable of suppressing notifications during specific intervals.
In contrast, Grafana presents a fully-fledged alerting system enabling the creation and supervision of alerts directly from the Grafana interface. The interactive and distinctly visual nature of Grafana’s alerting system simplifies the process of creating and managing alerts.
Prometheus Alert Manager
The operation of Prometheus's Alertmanager is controlled by a configuration file specifying the circumstances for triggering alerts and the subsequent actions that need to follow.
Consider a standard alert rule in Prometheus:
In this instance, an alert named SignificantLatencyDelay is initiated if the average request delay for the job myjob surpasses 0.5 for a duration of 10 minutes. This alert is tagged with a severity label page.
Grafana Alerting Framework
Grafana differs from Prometheus by facilitating alert creation through a graphical interface. The alerts can be generated directly on the data visualization panel.
To create an alert in Grafana, follow these steps:
- Locate and select the bell icon on the panel meant for alerts, on the panel menu.
- Select
Create Alert. - Formulate your alert criteria. Multiple requirements can be stipulated and linked with AND or OR operators.
- Determine the frequency at which the alert rule must be assessed.
- Coordinate the notification details. The notifications can be deployed to one or multiple notification channels as per your choice.
Relative Analysis
Prometheus's Alertmanager and Grafana have rich alerting capabilities, each offering a unique approach. Alertmanager in Prometheus is loaded with sophisticated features like alert direction, sorting, suppression, and muting. However, these alerts need to be formulated in a configuration file, which may be a tad complex for novices.
Meanwhile, Grafana's alerting system is comparatively more user-oriented. It allows for the direct creation and supervision of alerts from the dashboard via the graphical interface. Nevertheless, it does not incorporate advanced features available in Prometheus's Alertmanager.
To summarize, whether Prometheus or Grafana is better suited for alert management depends on specific user requirements and preferences. Prometheus would be ideal for those requiring advanced features and who are comfortable handling configuration files. Grafana, on the other hand, would be preferred by those who value user-friendly and visually engaging alerting systems.
Prometheus and Grafana: Performance and Scalability Assessment
In this section, we'll take an in-depth look into two key considerations of a monitoring tool - performance and sustainability - focusing primarily on Prometheus and Grafana.
Performance
Prometheus
Tailored for high reliability, Prometheus is like your safety net during an unexpected outage, aiding rapid issue diagnosis. Each Prometheus server operates autonomously, devoid of the dependency on network storage or other services. Hence, it is beneficial when the rest of your infrastructure is down and you need insight into the ongoing problems.
Prometheus works by fetching metrics from scrutinized targets at specified intervals, examining rule expressions, showcasing the outcomes, and can set off alerts if a particular state proves to be accurate. Such a strategic design offers substantial performance even under network disruptions or complete failures.
Grafana
Grafana, conversely, is an open-source, multi-environment analytics solution, two-way visualizing web application. It can provide charts, graphs, and alerts on the web when in conjunction with supported data sources, one of which is Prometheus. Grafana's expandability through plugins and its capability to load dashboards from a primary server at the time of startup make it a good choice.
Unlike Prometheus, Grafana's performance greatly depends on the data source it is associated with. Being a visualization application, Grafana refrains from storing any data. It commands the data source every time someone requests a dashboard or visualization. Therefore, Grafana's performance directly synchronizes with the performance of its data source.
Scalability
Prometheus
Prometheus handles upscaling decently up to a handful million series per server. This number is subject to variation based on the hardware and specifics of the application. Every server operates individually for reliability, depending solely on local storage.
Albeit not offering direct support for highly available clustering or distributed storage, it's possible to realize high availability at the infrastructure tier or by using federation - an approach that allows fetching a partial set of metrics from another Prometheus server.
Grafana
Unsurprisingly, Grafana's scalability hinges on the connected data source. Since Grafana refrains from storing data, it can deal with as many metrics as the data source presents. However, an increasing amount of metrics correlates with an added load on the data source, ending in slower queries.
On the user scalability front, Grafana handles several users simultaneously. It backs user authentication, lets you offer distinct access levels to different users - a feature that allows various teams to work on the same Grafana instance without conflict.
Performance and Scalability Comparison
In essence, both Prometheus and Grafana showcase certain pros and cons with respect to performance and scalability. Prometheus delivers reliable performance and decent scalability, yet it falls short in terms of high availability and distributed storage support. Grafana stands out in terms of user scalability and adaptability, but its performance relies on its linked data source. Hence, choosing between these two is subjective to the specific needs and requirements of your use case.
Integrations and Plugins: Comparing Prometheus and Grafana’s Flexibility
Prometheus and Grafana, two industry leading monitoring systems, each boast impressive features in terms of integration capabilities and plugin expandability. However, these two differ markedly in their approach and resultant functionality.
Delving into Prometheus: Seamless Integration and Modified Plugin System
With a focus on integration, Prometheus is recognized for effortlessly dovetailing with multiple systems. Its reach extends to various environments including Kubernetes, EC2, and Azure thanks to its vast selection of service discovery options.
Rather than fetching metrics through a usual push method, Prometheus utilizes an HTTP pull-based model. With this technique, it effortlessly interacts with any system compatible with HTTP for metric exposure. Its adaptability and flexibility, therefore, knows no bounds.
Bucking the typical plugin system trend, Prometheus adopts exporters to broaden its scope. In essence, exporters are independent applications designed to convert metrics from third-party systems into a language Prometheus comprehends. A wide array of exporters are at hand for Prometheus, ranging from databases such as MySQL and PostgreSQL, messaging systems for instance RabbitMQ and Kafka, down to hardware-related metrics covering CPU and memory usage.
Consider this Python snippet as an example of how an exporter operates:
Grafana Uncovered: Abundant Plugin System and Easy Integration
Grafana serves as a visualization tool, its strength lies in its buxom plugin system. Boasting myriad plugins, Grafana offers the chance to augment its fundamental functionality, providing new data visualisation techniques and data sources.
Aside from integrating with numerous data sources such as Prometheus, InfluxDB, Elasticsearch, Grafana's plugin system allows even further expansion.
Divided into three core types, Grafana plugins include panel plugins, data source plugins, and app plugins. Each type serves a specific purpose, introducing new visualizations, accommodating more data sources, and bundling data sources and panels to cultivate a cohesive user experience.
This is an example of how to install a Grafana plugin:
The above command is responsible for installing the Pie Chart Panel plugin, followed by a restart of the Grafana server to implement the new plugin.
A Face-off: Prometheus and Grafana
To summarize, Prometheus and Grafana both possess the versatility requisite for system integration and plugin implementation. By virtue of its ability to dovetail with a range of systems and application of exporters, Prometheus shows outstanding adaptability. Conversely, Grafana mesmerizes with its far-reaching plugin system enabling fresh visualization techniques and data sources. Your selection from the two would be dictated by your specific requirements and work environment.
The Role of Prometheus in Kubernetes Monitoring

Prometheus, an avant-garde system and progressive data enclave, has rapidly scaled the tech echelon, winning the approval and trust of development experts. It's a powerful device that's key in managing Kubernetes, focusing chiefly on its unwavering dependability and effective operation of Kubernetes clusters. Its relevance is deeply rooted in the DevOps field.
Prometheus' Function within the Kubernetes Ecosystem
Jointly operating with Kubernetes, Prometheus enhances its efficiency by offering real-time, detailed analytics and comprehensive examination of your Kubernetes setup. It accomplishes its goal by gathering data matrices from organized operations or short-term third-party channels for interim plans.
Proactively, Prometheus employs unique data sourcing techniques, gathering metrics directly from Kubernetes core, rather than simply waiting to receive data. This method minimizes chances of misunderstanding and guarantees that Prometheus constantly has the latest information from your Kubernetes platform.
Kubernetes Metrics Monitored by Prometheus
Prometheus watches a variety of metric factors related to Kubernetes:
- CPU Usage: Prometheus effectively tracks CPU utilization across all the pods and nodes in a Kubernetes cluster, facilitating the detection of potential performance complications or overuse scenarios.
- Memory Usage: The system vigilantly oversees memory use throughout your Kubernetes activity to ensure it falls within the dedicated resources granted.
- Disk I/O: Prometheus obtains the power to control disk read-write operations, supplying a performance overview for the disk in your Kubernetes hubs.
- Network Operations: Prometheus can inspect Kubernetes pods and nodes' incoming and outgoing network traffic paving way for timely identification of potential network-related issues.
- Pod/Node Status: Prometheus continually monitors the wellbeing of your pods and nodes, staying alert to send out notifications if any malfunction.
The Role of Prometheus Operator in Refining Kubernetes Management
Created specifically for Kubernetes, the Prometheus Operator makes it simpler to install and initiate Prometheus within Kubernetes. It's packed with several API utilities that compose the foundational architecture for your Prometheus system's optimal state, hence easing its upkeep.
Key features of the Prometheus Operator are:
- Service Monitor: This autonomous feature routinely detects the services within the Kubernetes cluster and instructs Prometheus to collect metrics.
- Prometheus Rule: This suggestion tool establishes alert guidelines for Prometheus, ensuring you're promptly informed about potential snags in your Kubernetes platform.
- Alertmanager: This component handles the alerts that Prometheus triggers, steering them toward appropriate notification techniques (emails, Slack, etc.).
The Combined Power of Prometheus-Kubernetes Collaboration
When Kubernetes and Prometheus join forces effectively, they create a thorough monitoring system for the applications running on your containers. With Prometheus's extended service provision, you gain a holistic understanding of Kubernetes operations. This proves invaluable in enhancing efficiency, identifying potential obstacles, and preserving the integrity and lifespan of your applications.
In conclusion, Prometheus plays a formative role in overseeing Kubernetes ventures. Being vested with essential tools and capabilities to effectively assess the Kubernetes atmosphere, Prometheus positions itself as an invaluable resource for any DevOps team.
Grafana's Take on Internet of Things (IoT) Monitoring
IoT (Internet of Things) has transformed the way we engage with devices and interpret data. As the connectivity of devices amplifies, so does the requirement for efficient supervision solutions. The solution that stands out in this domain is Grafana, owing to its extensive functionalities and adaptable architecture.
Grafana: Coining a New Era in IoT Supervision
Grafana pioneers a distinctive approach to IoT supervision by emphasizing the pictorial representation of data from diverse sources in a comprehensive, and accessible format. It's compatible with a broad spectrum of database types, notably InfluxDB and TimescaleDB, gaining favoritism for IoT applications. This compatibility enables Grafana to manage the swift and large-scale data influx typical in IoT contexts.
By virtue of its modifiable panels and charts on the dashboard, Grafana offers an immediate from-the-ground-up perspective of device metrics, network data flow, sensor details, etc. Quick identification and troubleshooting of problems using this mode of real-time monitoring can avert excessive system standstills and losses.
Data Picturization and Breakdown
Grafana fortifies its stance in IoT supervision with its impressive data picturization capabilities. It empowers users to develop adaptive, interactive dashboards that can illustrate data in several formats such as charts, tables, heatmaps, etc.
The above instance of a Grafana dashboard panel setup signifies how temperature data from IoT appliances can be pictured using Grafana by grouping them according to time and appliance while representing the average temperature.
Alerting Mechanisms and Anomaly Tracking
Grafana’s alerting mechanism and anomaly tracking are exemplary in the realm of IoT supervision. The alerting framework in Grafana enables setting alert parameters based on specific circumstances and offers notifications through various means like email, Slack, PagerDuty, etc. when these stipulations are met.
Consider an alert rule programmed to initiate a notification if the temperature recordings from a specific device breach a set limit. This facilitates proactive identification and rectification, thus minimizing potential operational disruptions.
Convergence with Auxiliary Tools
Grafana further showcases its versatility with its convergence capabilities. It fuses effortlessly with other tools predominantly utilized in IoT settings, for instance, MQTT mediators for device interaction, and data handling systems like Apache Kafka or AWS Kinesis.
This consolidation facility qualifies Grafana to operate as a primary supervision hub in an IoT framework, providing a consolidated data view from various origins and facilitating detailed monitoring and investigation.
In summary, Grafana, with its versatile architecture, superior data picturization features, sturdy alerting mechanisms, and effortlessly fuses with auxiliary tools, emerges as a top-notch choice for IoT supervision. As the IoT sphere advances, Grafana's resilience and multi-functionality underline its persistent relevance and efficacy in the supervision solution space.
Security Features: Assessing Prometheus and Grafana
In the domain of tracking software, safety protocols are a critical factor. The twin tools of Prometheus and Grafana were shaped keeping security as their focal point, but their methods are divergent. This section will focus on unpacking the safety mechanisms offered by both, drawing a detailed juxtaposition that assists you in forming a calculated preference.
Looking at Security through the lens of Prometheus
As an open-access tracking resource, Prometheus has a sturdily built defensive framework. It bankrolls a pull mechanism that retrieves measurements from the monitored targets at a predetermined frequency. The natural property of the pull mechanism is such that it diminishes the chances of unwarranted intrusion as it keeps the ports of the monitored systems closed.
It boosts secure exchanges via Transport Layer Security (TLS) and fortifies itself through Basic Authentication. However, it bears emphasis that these mechanisms are in a dormant state by default and demands manual triggering.
Prometheus does not possess naturally integrated user administration or command control mechanisms. It instead turns to external systems and a reverse proxy for performing these functions. This alternative method standardizes adaptability but might necessitate supplementary installation and maintenance efforts.
Here is a concise description of Prometheus’ security measures:
- Usage of pull mechanisms for collecting measurements
- Provision for TLS and Basic Authentication
- Dependency on external mechanisms for user administration and command and control functions
Decoding the Security Features of Grafana
On the flip side, Grafana provides a more spanning and inherent set of security features. It approves secure exchanges using HTTPS and showcases a stalwart user administration and command control setup. Grafana lets you set teams, users, and organisations and define permissions on numerous levels.
Adding to this, Grafana supports proxying data sources where the Grafana back-end manages all communications with data sources, thus adding an extra barrier of safety. It also possesses in-built safeguards against attacks like Cross-site Scripting (XSS) and Cross-site Request Forgery (CSRF).
Here is an abbreviated list of Grafana’s security mechanisms:
- Provision for HTTPS
- Comprehensive user management and access control
- Data source proxying
- Built-in shields against XSS and CSRF assaults.
Security Standoff: Prometheus and Grafana
The security provisions of Prometheus and Grafana, when it comes to a face-off, it’s apparent that Grafana delivers a wider range of ready-to-use features. However, the dependency of Prometheus on external mechanisms for user administration and control commands is actually beneficial as it standardizes adaptability and allows an easy merger with current safety structures.
The comparison table below shows the variations in their security implementations:
In essence, Prometheus and Grafana have solid security provisions but their strategies towards safety differ. The choice between the two will largely depend on your specific requirements and the existing equipment.
Cost Analysis: Pricing of Prometheus vs Grafana
Deciding on an observability solution involves financial considerations, and in this landscape, Prometheus and Grafana have gained attention. But how do they fare in the cost department? Let's run a price breakdown for these two potent observability instruments.
Freely-Available Source Code: An Economic Edge
Both Prometheus and Grafana operate on open-source software principles, which make them available for customization and distribution at no cost. This affordability, particularly for cash-strapped startups and small firms, is a major economic edge introduced by the open-source paradigm.
However, their non-existent price tag doesn't mean they are devoid of expenses. There can be overheads related to implementation, upkeep, and assistance, which are contingent on your infrastructure intricacy and your team's acumen level.
Prometheus: A Glimpse at its Fiscal Dimension
Prometheus guarantees a costless governance. License fees are a thing of past, enabling limitless monitoring of systems and services at no extra cost.
Yet, you may be incurring expenses based on your storage needs, as Prometheus earmarks its time-series data both in-memory and on local disks. Large data quantities might necessitate supplementary storage investment.
Additionally, to supplement Prometheus's basic visualization capabilities, integration with an advanced visualization tool like Grafana may be required, thus marginally elevating the cost equation.
Grafana: A Peek into its Financial Demand
Matching Prometheus, Grafana too is cost-free. However, it does offer Grafana Enterprise—an enhanced version armed with added features and expert assistance with variable cost based on your company size and specific needs.
Grafana Enterprise includes attributes such as data source permissions, reporting mechanisms, and augmented LDAP integration. If these elements are vital, Grafana Enterprise’s cost might justify its return on investment.
In terms of hardware, Grafana operates with minimal resources implying lesser associated costs. Like Prometheus though, your expenses might inch up based on your data visualization and storage specifications.
Concealed Charges: Configuring, Sustenance, and Assistance
Despite Prometheus and Grafana being costless, it's crucial to bear in mind potential invisible expenditures inclusive of setup costs, recurring maintenance charges, and support-related costs.
Deploying Prometheus and Grafana, particularly in populous and geographically scattered settings, can be cumbersome. You might need to enlist external guidance or invest in team education if you lack in-house proficiency.
Recurrent upkeep expenses such as software upgrades, anomaly diagnosis, and data management may cumulatively result in substantive costs.
Finally, while Prometheus and Grafana have community-backed support, professional assistance may carry additional charges. Grafana provides professional support along with Grafana Enterprise, whereas for Prometheus you might have to turn to providers from outside.
In summarization, although Prometheus and Grafana are cost-free, the cumulative cost of ownership may differ based on your specific needs and available resources. Therefore, do factor in these considerations while choosing between the duos.
Prometheus and Grafana: Community Support Comparison
Open-source software thrives when backed by sturdy community guidance. This principal applies to both Prometheus and Grafana, two major players in the market. Community assistance for these platforms comes in many forms, from developing the software to aiding newcomers. But, the nuances of community support for each differ slightly - that’s what we explore in this segment.
Sustenance from Prometheus’ Community
Among the umbrella of the Cloud Native Computing Foundation (CNCF) projects, Prometheus stands tall. A colorfully diverse community of devoted developers, passionate users, and zealous enthusiasts provides continuous support. They nourish the project by coding, chalking bugs, suggesting improvements, and extending helping hands for bug fixes.
The Prometheus community is well-connected via their mailing list and GitHub. The mailing list serves as a platform for discussion, news, and queries, whereas GitHub is where code contributions and issue processing takes place.
Another strong reason behind Prometheus' success is an all-embracing, up-to-date set of documents crafted by its community. From beginner’s set-up to proficient levels, they’ve covered it all.
Backing by Grafana’s Community
Grafana’s supportive community echoes much of the diversity and commitment of Prometheus. This includes seasoned developers, active users, and even Grafana Labs employees, all working collaboratively. They donate their skills to develop the software further, rectify bugs, suggest feature enhancements, and assist fellow users effectively.
Grafana’s community is most vocal on their community site, GitHub, and Slack. Their community site is a hub for exchange of ideas and asking questions. GitHub logs in the code improvements and tracks issues, and Slack is used for swift, instantaneous communication.
Grafana’s community, with Grafana Labs, maintains exhaustive documentation that comprehensively details the software's every attribute. Staying true to its community-based roots, it guarantees correctness and up-to-dateness.
Analysis
Prometheus and Grafana both enjoy robust backing from their communities. However, they do differ in their communication methods. Prometheus leans towards a mailing list, while Grafana prefers a community site and Slack. One could theorize that Grafana might provide quicker, live support, contrasting with Prometheus' more methodical approach.
Another difference lays in their documentation. Both platforms have impressive resources covering a diverse range of topics. Yet, elements like topic exclusivity and the contributors' proficiency can cause variations in document quality and depth.
To sum up, strong community support is a cornerstone for both Prometheus and Grafana, but the structure and operation of their communities differ. Potential users may wish to take these differences into account when choosing between these platforms.
Case Study: Real-world Usage of Prometheus and Grafana
In the real-world scenario, let's consider a multinational corporation that manages a vast network of servers and applications. The company's IT department is tasked with ensuring the smooth operation of these systems, which involves monitoring performance, identifying issues, and resolving them promptly. To achieve this, they employ Prometheus and Grafana, two of the most popular open-source monitoring tools.
Prometheus: Monitoring System Performance
The IT department uses Prometheus to monitor their system's performance. Prometheus's pull-based model is ideal for the company's needs. It allows them to collect metrics from their monitored targets at regular intervals, providing a snapshot of system performance over time.
Prometheus's powerful query language, PromQL, is used to analyze these metrics. For instance, the IT department can use PromQL to determine the average CPU usage of their servers over the past hour, or identify servers that are consistently under high load.
Here's an example of a PromQL query that the IT department might use:
This query returns all instances where the average CPU usage over the past hour exceeded 80%.
Grafana: Visualizing Data
While Prometheus excels at collecting and analyzing metrics, it's not designed for data visualization. This is where Grafana comes in. The IT department uses Grafana to create dashboards that visualize the data collected by Prometheus.
For example, they might create a dashboard that displays the average CPU usage of each server over time. This allows them to quickly identify servers that are under high load and may require attention.
Here's an example of how they might configure a Grafana panel to display this data:
Prometheus and Grafana: A Powerful Combination
By using Prometheus and Grafana together, the IT department can effectively monitor their systems and respond to issues promptly. Prometheus provides the raw data and analytical capabilities, while Grafana provides the visualization tools that make this data easy to understand.
In this case study, the combination of Prometheus and Grafana has proven to be a powerful tool for system monitoring. The IT department can now monitor their systems more effectively, identify issues more quickly, and resolve them more efficiently. This has resulted in improved system performance and reliability, and ultimately, a better experience for the company's customers.
Conclusion: Making the Choice – Prometheus or Grafana?
Discover the capabilities and functionality of two outstanding monitoring utilities, Grafana and Prometheus. Together, they act as complementary parts of a sophisticated machinery, aiding in developing an all-inclusive monitoring solution. You may choose to use one or both in combination, depending on your project's unique needs.
Streamlining the Selection of Monitoring Tools
Adopt a selection strategy that aligns with your distinct necessities. Prometheus, with its innovative open-source profile, perfectly fits use-cases demanding in-depth analysis and control over multi-dimensional data sets. It is especially adept at integrating with microservice-based architectures and containerized systems, thanks to its seamless interoperability with Kubernetes.
Conversely, if your preference leans towards data display and processing, Grafana will meet your needs. With its wide variety of data representation capabilities and flexibility in dealing with different data inputs, Grafana can act as a powerful guard for your monitoring data.
Dual-Pronged Approach - Joint Operation
Combining Prometheus and Grafana forms an advanced tactic. Prometheus efficiently gathers and preserves data, while Grafana turns into the wizard, yielding impressive data visuals. By synergizing these two tools' capabilities, you obtain a complete, all-knowing monitoring setup.
Boosting Performance and Extensibility Measures
Prometheus and Grafana are both trustworthy contenders for monitoring large-scale networks. Prometheus relies on its dynamic framework, seamlessly scaling with your expanding network. Grafana demonstrates its robustness by managing massive data volumes without glitching, courtesy of its independent architecture.
Guaranteeing Data Security and Fostering Community Contributions
Prometheus and Grafana emphasize the importance of protecting your monitoring data. The reliability of these accessible utilities in terms of security is closely tied to community engagement.
Community participation in Prometheus and Grafana is significant, with contributors routinely providing content improvements, novel features, and prompt bug fixes. For those requiring focused attention, premium versions of these utilities are also available.
Financial Planning
Budgeting plays a vital role in decision-making. Both Prometheus and Grafana, as free-of-charge resources, impose no financial burden. For an upgraded experience or specialized support, Grafana offers a paid version, while additional Prometheus features necessitate engaging third-party service providers.
In conclusion, the choice between Prometheus, Grafana, or using them together largely depends on your project's specific monitoring requirements, network size, availability of security protections, and budget constraints. Deploying both tools in tandem creates a thorough monitoring infrastructure.
FAQ
Subscribe for the latest news


.jpeg)