What is observability? Full guide by Wallarm
Observability examines telemetry data to control when, where, and why app failures occur. Gauging how applications appeared in the weeks leading up to a problem is no longer common practice.
Because of observability advancements, SRE and Developer Ops teams can now closely monitor their disseminated systems in actual time. It lets them find problems and fix them before they affect a large number of target customers.
It is the full guide if you're just starting as a developer or are interested in learning. What does it mean? Why is it essential, what benefits does it provide, and how do you implement it in cloud-based platforms? This detailed guide will answer all of these questions.

What Is Observability?
You need the technology and processes to ask any question you want about your network. It is the essential component of having observability.
It is a theory that comes from the study of mathematics and, more specifically, control theory. If you can deduce the value of the beginning state from the system output, it is said to be "observable."
A network must be observable and controllable to be called "controllable," which means you can change the system's state by changing the input. In the field of information systems, "observability" means the ability to see and figure out how a whole software network works.
It is a new field that is growing quickly. Both DevOps and Software engineering teams use it. Observability engineering differs from other monitoring systems because it lets people look at features and patterns without collecting predefined data sets.
Companies that use observability can expand their monitoring solutions by centralizing data from many sources, not just their app's tech stack.
Because of the observability, they are free to question the application staging and any data connected to their business. They can quickly find and isolate problems that affect the business, make their end users happier, and speed up their time to market by focusing on innovation. All of this is possible because the information is put into context.
The Importance of Observability
Modern systems are becoming cloud-based, open-source microservices on Kubernetes clusters. Scattered teams make them quicker than ever. DevOps, unceasing delivery, and agile growth make it easier to release software faster, but they also make it harder to find bugs.
Things went wrong in the days of mainframes and stable operations, and pre-configured motionless dashboards updated the operator. These systems repeatedly failed in identical behaviors.
As systems became increasingly complicated, monitoring technologies tried to reveal program performance. Time series and monitoring data analytics can track application performance.
Today, failure causes are abundant today—and can feel limitless when you're frustrated.
When observability is deprived, it is difficult to discover a link damaged in network and sharing systems. With microservices designs common, teams share responsibilities. Teams must investigate and debug non-owned application ranges. Distributed tracing lets you track down requests—and bottlenecks—across a sharing structure.
Observability vs. Monitoring
It's practicable to make the case that monitoring falls under the category of observability as a subset. Monitoring is the first step toward making all parts of your business fully scalable and observable. Observability leverages records, benchmarks, and trails to maintain network health and understand issues. Together, they use external outcomes to assess internal conditions.

What Are the Three Components of Observability?
Keeping track of records, benchmarks, and trails is important since they form the backbone of observability. Even if access to these services does not ensure better system visibility, they are valuable tools you can use to build stronger networks.
- Logos
Logs provide raw system information to help you comprehend your database. A diary of occurrences is a permanent record of actions taken at specific times. In each of the three formats event logs can handle, you'll find the same data—a date, a payload, and some background information.
- Plain text: A log entry can just be a string of characters. Most logs are written in this format, making it the most common choice.
- Structured: This type of log is sent in a structured manner, specifically JSON.
- Binary: It includes Protobuf logs, MySQL BinLogs for duplication and point-in-time recovery, Systemd journal logs, and the BSD firewall pf's PFLOG format.
- Metrics
It shows the overall functioning of a service or component across time. Metrics' name, value, label, and timestamp communicate SLA, SLO, and SLI data.
Metrics are quantifiable system performance values, not individual events, and save time by correlating infrastructure components to show health and capability. They improve data search and preservation.
Metric discovery lacked exploratory analysis and filtering. Early versions of Graphite's hierarchical metric method lacked tags or labels.
Each time series included a metric name and key-value pairs, called labels in current monitoring systems like Prometheus and high-dimensional Graphite.
- Traces
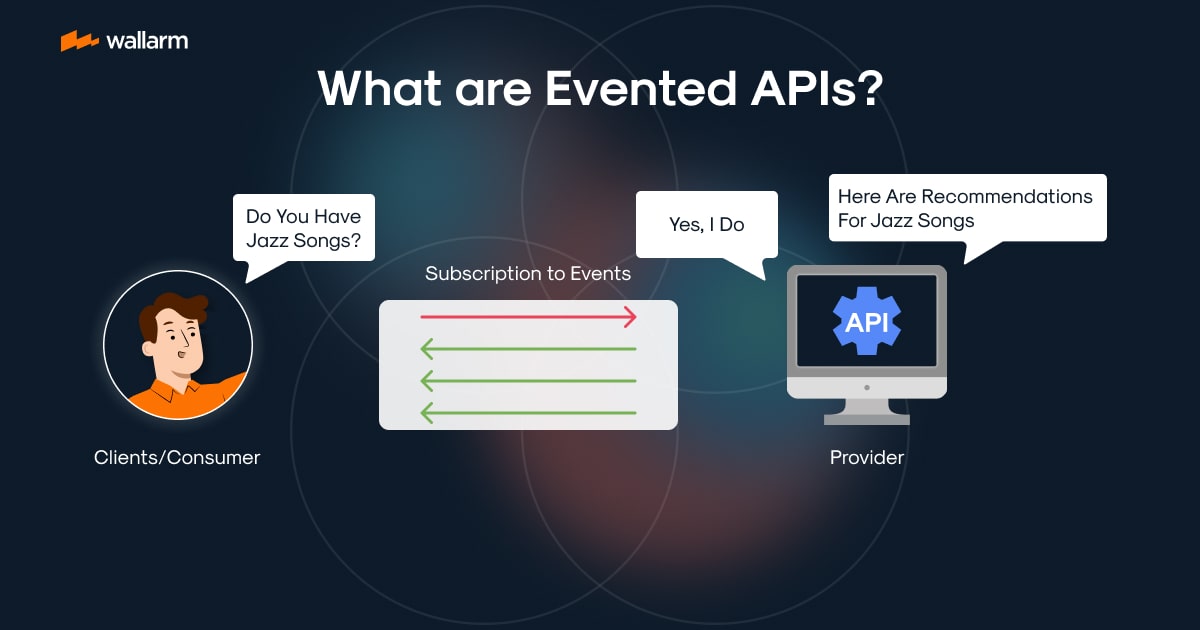
You can use logs and metrics to figure out how healthy a system is, but they don't help much when you want to find out where a request came from in a distributed system.
Instead, a separate observability method called "tracing" is used to see and understand the whole lifecycle of a request or action across several systems.
In a sharing network, the nodes are "traced" to show where an appeal or action went the whole way. Profiling and monitoring systems, especially those based on serverless, microservices, or containerized application architectures, are greatly assisted by discovering their activities.
By looking at trace data, you can determine how the system is doing to find slowdowns, find and fix bugs faster, and determine which parts of the system would benefit most from optimization.
Benefits of Observability
Even though digitalization is getting more complicated, observability tools help engineers and developers improve the customer experience. With the help of observability, all kinds of telemetry data can be collected, explored, alerted on, and linked together.
Improvements in operational efficiency and growth can be fueled by increasing the system's observability. For example, teams can use an observability platform to determine what caused important events and take steps to ensure they don't happen again. As a result, MTTR is increased while downtime is reduced.
When a new build is released, they may keep an eye on how it affects the application's performance by looking into the causes of any changes that don't make sense, like an increase in the number of errors or a delay in the response time. They can easily identify the faulty node.
In addition to these advantages, observability also has:
- One reliable place to store all relevant operational data,
- Proven reliability and efficiency,
- Knowledge of how your digital company's performance changes in real-time,
- Enhanced communication between departments for quicker problem solving,
- Innovation-friendly organizational norms,
- You can reduce time to market and software quality increased by increasing the efficiency of operations,
- In-depth information for maximizing investments and making more informed data-driven business decisions.
What Are the Problems of Observability?
Traditional monitoring solutions frequently monitor just one application or server in a monolithic system. Observability has several issues, such as:
- Complex dynamic situations
The rapid release and adoption of new technologies create a flood of data and changeable monitoring settings. With manual tools and traditional monitoring, IT teams struggle to comprehend how their environment functions. Teams need tools to understand dependencies and reduce blind spots.
- Monitoring containers, microservices
Containers and microservices accelerate modern software development. The microservices observability architecture's dynamic nature makes real-time visibility into container workloads difficult.
IT staff can't trace user requests across microservices without the correct tools to find anomalies. They either consult the system's designers and guess what went wrong.
- Data volume, velocity, and variety
Teams use tools and dashboards to sift through a rising stream of data to set behavioral norms in a changing environment. How do you track unknown issues? IT uses timestamps or guesswork to pull data from static dashboards to show that a system is failing.
- Observability's commercial impact is hard to measure
Most engineers recognize the need for observability tools and best practices, but creating the business case can be tough.
Observability In Containers and Microservices
To help developers find and resolve operation issues, observability in microservices and containers makes production network states visible. However, introducing them results in many decoupled parts spread across a network of servers.
According to research, 70% of CIOs think keeping tabs on containerized microservices in real time is impossible. Observability solutions are helpful because they make apps run faster and more available by giving distributed networks real-user monitoring.
Observability in DevOps
DevOps is a way of working that puts the delivery of high-quality products and quick iterations ahead of long development cycles. Since more frequent releases depend on the application's or product's reliability, it must be robust and error-tolerant.
In the context of DevOps, "observability" refers to the software mechanisms and processes that allow the Dev and Ops teams to log, collect, correlate, and analyze a lot of real-time performance information from a distributed network. It will facilitate teams to easily track, update, and enhance the app for the user’s benefit.
Observability in Software Engineering
A common definition is output logs offer regarding networking, allowing administrators and software programmers to keep an eye on things. As a bonus, this data helps software developers learn more about how their customers use their apps, which is important for adding new features and making the apps easier to use by more individuals.
When making software, the groups practice observance to learn about their projects' inclusive health, presentation, and error history. Engineers can determine a system's health by looking at its procedures, metrics, logs, and traces.
Observability Use Cases
It is sometimes considered a catch-all, which conceals distinct practices. Observability is related to IT systems, capacities, and infrastructure. This IT stack layer appropriation ignores data and model observability.
- Observability: It often refers to IT systems and gives users an investigative forum to question operational data.
- Data Observability: It uses the same principles but focuses on the data layer instead of the entire IT system. Moving data quality assurance upstream allows for early debugging and mitigating errors before contaminating a data group or producing systemic data quality problems. Enterprises control data dependability energetically and repeatedly through data observability. Data observability provides quality data outputs for informed business decisions.
- Modeling Observability: Observing model artifacts helps machine learning developers determine when and where errors emerge. Engineers can construct more precise models and make better judgments by identifying data sense, bias, and integrity issues.

Criteria For Good Observability Tools
Open-source, commercial, custom, or cloud observability tools should share characteristics. Here's how to choose a proper tool:
- User-friendly: The tool should be simple.
- Real-time data: Dashboards, reports, and searches should deliver real-time information.
- The tool should interface with your existing ecosystem or tech stack..It should support your contexts and languages.
- Visualize aggregated data in dashboards, graphs, charts, etc.
- Event-handling techniques: The observability tool should capture relevant data from diverse sources, tech stacks, technologies, and operating environments. It should select important/unimportant information and offer context.
- Provides context: When a problem develops, the observability tool should deliver context to identify its fundamental cause, scope, interdependencies with other components, and structure performance effect.
- Uses AI/ML: The tool should employ AI/ML to systematize repetitive processes and find patterns that benefit evaluate root causes.
- Delivers business value: The observability tool should give business benefits like faster deployment, better system stability, and improved customer experience.
How To Implement Observability?
You may be wondering how to make your system visible. The five key components of observability are:
- Instrumentation uses open-source or vendor-specific telemetry data to provide infrastructure awareness.
- Distributed tracing demonstrates how a system's microservices are interconnected and maps out user requests.
- Your observability platform must have an incident alerting system that notifies the right IT personnel.
- Correlating telemetry data helps you create graphs and charts. These visualizations will help your team understand the collected data and time series peaks and falls.
- Machine learning models aggregate, correlate, and prioritize incident data. AI Ops tools speed incident response and improve MTTP (MTTR).
FAQ
References
Subscribe for the latest news

.png "AWS with Wallarm")