See Wallarm's AI Control Platform In Action
Prometheus vs TimescaleDB Time-Series Databases
Introduction to Time-Series Databases
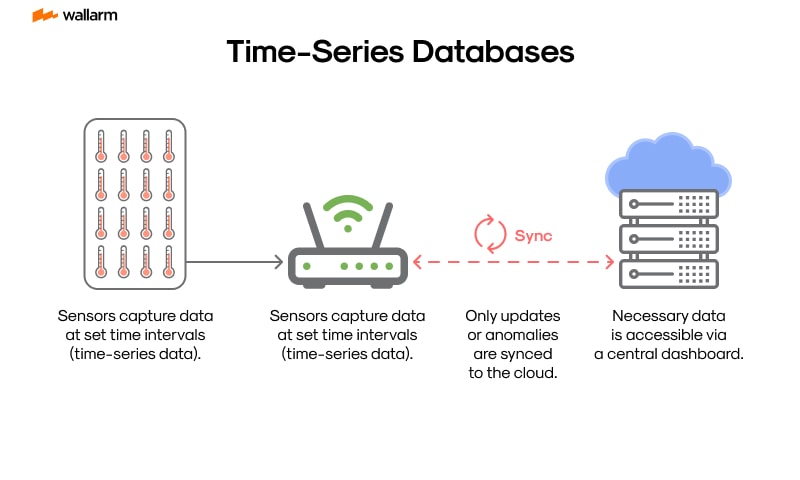
Time Chronological Repositories (TCRs) function as distinctive databases that systematically organize data in relation to time. This unique data, termed as clock-bound sequential information, is formed by progressive segments of data positioned in order along intervals of varied durations. This data is gathered incessantly, in harmony with the trajectory of time.
Venturing into Clock-Bound Sequential Information
Clock-bound sequential information is omnipresent across multiple areas of studies. For example, financial consultants utilize this kind of data derived from the rise and fall of stock markets to foresee probable market transformations. Likewise, information from IoT devices and scrutinized server logs for supervising network processes also exemplify this data form. Each successive reading marked over a specific time duration is classified as clock-bound sequential data.
This data possesses dual characteristics. Firstly, every segment of data embodies a timestamp that specifies the date and time of data acquisition. Secondly, data of this nature is accumulated routinely at set intervals, varying from seconds up to hours. The structure of clock-bound sequential data follows an append-type model, where fresh data continually broaden the collection base, with minimal changes made to the existing data.
Importance of TCRs
Conventional relational databases face a hard time handling time-series data because these infrastructures struggle to manage the rapid inflow and outflow of vast data while answering to complex queries.
Identifying this challenge, TCRs have been purposely shaped to withstand these hurdles. Compared to classic databases, TCRs offer several benefits including:
- Swift Operations: TCRs are architected for rapid retrieval and aggregation of clock-bound sequential data. They utilize custom-made data frameworks and storage plans to deal with voluminous data and intricate queries.
- Scalability: TCRs underscore horizontal growth capability, hence can hold larger data quantities by spreading it across multiple nodes.
- Time-Centric Attributes: TCRs encompass inbuilt faculties suitable for clock-bound sequential data, such as accumulating information, downsampling, and time-based storage policies.
- Data Compactness: TCRs utilize techniques that shrink data to lessen the storage space needed for time-series data.
Favorable TCRs
Many clock-based database systems are trending now and each comes with a unique array of pros and cons. Two notable instances are the Prometheus and TimescaleDB. Prometheus serves as a robust open-source instrument for tracking and alarm generation, while TimescaleDB operates as a cost-free database explicitly for clock-bound sequential data. Deployed atop PostgreSQL, it masterfully merges the functionality of a classic database with the robust scalability of a time-recording database.
The succeeding part dives into an in-depth examination of these two database structures, scrutinizing their features, efficiency, and applicability across diverse operational scenarios. Real-life instances underscoring their application for supervisory functions will be illustrated. This examination aims to guide software developers, database curators, and corporate tacticians to make an informed choice between Prometheus and TimescaleDB for their clock-bound sequential data needs.
Prometheus: An In-Depth Look into What It Is
Consider Prometheus as a distinguished artisan, skillfully fusing disparate pieces of system surveillance and alerting with the affordability and transparency of open-source software. It originally took shape in SoundCloud's innovative workshops and has proliferated throughout the tech industry since then. It warrants attention at the nucleus of the Cloud Native Computing Foundation, alongside esteemed companions such as Kubernetes and Envoy.
The Inner Workings of Prometheus: A Deep-Dive
Prometheus is the embodiment of reliability in system monitoring, providing stability even in tumultuous scenarios. This is achieved by its self-governing design, where each Prometheus instance functions autonomously, liberating users from uncertainties regarding distributed storage or clusters.
Prometheus's data model is deceptively simple yet empowering. Crafted in multiple layers, it identifies time-series data through a combination of metric names and key-value pairings. This innovative method ensures accuracy in data categorization and compilation.
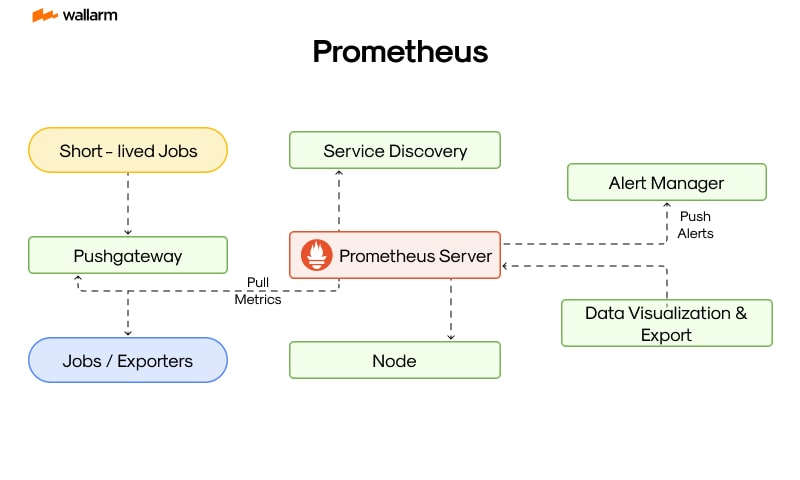
The Building Blocks of Prometheus
Prometheus's blueprint consists of pivotal divisions, each playing a crucial role in its optimal functioning.
- Core of Prometheus – The Server: This element is the lifeline, collecting and storing time-series data.
- Connectors – Client Libraries: These units facilitate integration of services into Prometheus, irrespective of their coding language.
- Backbone – Push Gateway: This mechanism offers support to transient tasks.
- Translators – Exporters: These units enable Prometheus to communicate with third-party services and applications beyond its direct reach.
- Gatekeeper – Alertmanager: This section manages alerts, categorizing and directing them to the intended receiver.
- Gateway to Data – Web UI and APIs: These facets provide access to your data and permit customized queries.
Decoding Prometheus's Data Model and Query Language
All the data in Prometheus is preserved as time series, defined as sequential streams of values labeled with the same metric and contextual dimensions. Each time series is distinctly recognized through its metric name and labels embodying key-value pairs.
Prometheus's query language, PromQL, is an advanced utility that provides real-time selection and merging of time-series data. With PromQL, you can morph and manipulate collected time-series data, paving the way for the creation of immediate graphs, charts, and alerts.
Prometheus's Approach to Data Gathering
Prometheus adopts a proactive approach to data acquisition, pulling it directly from designated tasks, or via an intermediate push gateway for ephemeral tasks. This method makes data collection seamless and error-resistant, allowing Prometheus to monitor targets passively.
Handling Alerts in Prometheus
Alert management within Prometheus is a dual-phase operation. Integrated alerting commands in Prometheus servers send alerts to an Alertmanager. This Alertmanager then assumes authority, tending to their silencing functions, inhibitions, grouping, and subsequent notifications using methods like emails, on-call systems, and chat interfaces.
Storage Mechanisms in Prometheus
Prometheus includes an indigenous on-disk time-series database and also offers optional connectivity with external storage systems. Its in-built storage is designed for proficiency and growth, accommodating millions of individual time series, including those with high cardinality.
In conclusion, Prometheus's power resides in its ability as a free-to-use monitoring system, gleaning data from various sources by extracting information from HTTP endpoints. Its strength lies in data shaping and query formulation, in sync with its independent server setup, making it a trustworthy guard for system and service supervision.
TimescaleDB: A Deep Dive into its Unique Advantages
PostgreSQL's robust design houses TimescaleDB, an authoritative tool especially adept at regulating and overseeing chronological data. Let's explore the distinguishing characteristics that set it apart from other similar databases.
Exceptional Integration with PostgreSQL
Drawing much of its power from an exceptional blend with PostgreSQL, TimescaleDB allows users to extract the maximum depth of capabilities that PostgreSQL brings. Specifically in relation to chronological data, the myriad of tools, additions, and libraries from PostgreSQL ensure a frictionless embedding of TimescaleDB into pre-existing networks and operations.
Moreover, TimescaleDB utilizes PostgreSQL's staunch data integrity, superior consistency, and transaction coherence, ensuring top-level security and command of your chronological data.
Unrivaled Capacity of Scalability and Efficiency
Designed to comfortably govern vast volumes of chronological data, TimescaleDB uses a unique approach called 'chunking'. This technique dissects data into smaller, more manageable subsets based on time or dimensions. This forward-thinking strategy allows TimescaleDB to manage enormous datasets, even those running millions of lines, without compromising query efficiency.
Advanced features such as automatic data lifecycle management, including bespoke data retention and stratification strategies, hand the reins of stitching and tailoring data storage to the unique specifics of the users.
Versatility and User-friendly Interface
TimescaleDB presents a flexible and user-friendly platform for managing chronological data. With full SQL support, it's easy to use for anyone familiar with SQL language, circumventing the need for learning new coding languages. This increases the tool adoption rate substantially.
Beyond that, TimescaleDB is accommodating to diverse data types, be it numeric, categorizable, or alphanumeric, making it the preferred choice for various chronological data use cases.
Advanced Analytical Potential
Equipped with progressive analytical potential, TimescaleDB equips users with the capacity to deduct meaningful patterns from chronological data. It excels in running intricate queries and alignments, simplifying expansive data analysis.
Continuous and immediate consolidations boost regular analytical query operations, positioning TimescaleDB as a trustworthy tool for real-time monitoring and analytical applications.
Stalwart Support and Dynamic User Community
Supported by committed developers and an enthusiastic user base, TimescaleDB ensures that user queries and technical glitches are promptly addressed. This vibrant community significantly aids the progressive development of TimescaleDB, keeping it at the forefront of innovations in temporal databases.
To wrap up, TimescaleDB offers an unmatched blend of features that makes it the go-to choice for managing chronological data. Its seamless meld with PostgreSQL, superior scalability and efficiency, flexible operations, progressive analytical capabilities, and active user community distinguishes it in the domain of temporal databases.
Key Features of Prometheus
Handling time-series data is a realm where Prometheus exceeds expectations due to its cutting-edge features. Let's take a closer look at the attributes which distinguish Prometheus from common time-series databases.
1. Peerless Multi-element Data Method
Prometheus introduces an unmatched strategy with its multi-dimensional time-series data, manifested through the metric identity, along with an associated key-value pair. This extraordinary approach empowers Prometheus with enhanced accuracy and rapidity in orchestrating data inquiries. As a result, operators can form filters and amalgamate data utilizing any label combination, thereby simplifying data analysis.
2. Sophisticated Inquiry Tool
Prometheus distinguishes itself with a sophisticated tool for questions named PromQL. This instrument conducts a thorough examination of the gathered time-series data, providing exhaustive investigative functions such as filtering, blending, and computation, thus easing data combination and extraction.
3. Innate Warning Mechanism
Prometheus is equipped with a responsive, embedded alert handler. It impeccably integrates with the Prometheus data structure to regulate alerts produced by customer applications, classify them effectively, eradicate replicas, and dispatch them to chosen endpoints like emails or operational tools such as PagerDuty or OpsGenie. It also controls the silencing and suppressing of alerts.
4. Vast Data Gathering Techniques
Prometheus backs several data procurement methods, encompassing an HTTP pull technique, hence guaranteeing sturdy reliability and versatility. If necessary, it can leverage a push strategy for ephemeral jobs through a portal.
5. Profound Service Recognition Methods
Prometheus is skilled in various service recognition practices (like Kubernetes, Consul, DNS SRV records), contributing to automatically pinpoint potential monitoring targets in volatile environments.
6. Highly Efficient Data Storage
Prometheus distinguishes itself with its proficient storage blueprint for time-sensitive data, further enhanced by optional remote storage integrations. It can preserve raw data for a given duration and uphold generated time-series data endlessly based on user discretion.
7. Data Illustration Competence
Though Prometheus presents data depiction through its inherent web interface, it can seamlessly interconnect with visual tools like Grafana for complex data representation needs.
8. Particular Client Libraries
Prometheus presents the opportunity to integrate application codes employing client libraries. It caters to several languages like Go, Java, .NET, Ruby, and Python.
9. Expandability Preferences
Prometheus caters to expandability requirements by endorsing both hierarchical and horizontal federation, hence adaptable to more extensive infrastructures.
10. Broad System Compatibility
The true brilliance of Prometheus is reflected in its extensive compatibility with a multitude of systems, capable of handling everything from charting and warning functionalities to persistent storage, thus securing its position as a reliable device in IT infrastructure monitoring strategies.
Owing to compelling aspects such as its bespoke inquiry models, sturdy warning system, broad compatibility, and other beneficial characteristics, Prometheus solidifies its value as a powerful tool for data tracking and statistical examination, elevating the bar in the time-series database field.
Uncovering the Unique Attributes of TimescaleDB
TimescaleDB builds upon the solid base of PostgreSQL, tailor-made to manage data in the time-sequence format. Our subsequent conversation will explore the exclusive traits of TimescaleDB that distinguishes it from the rest of the time-sequence databases.
Unmatched Capacity and Efficiency
At its core, TimescaleDB showcases exceptional scalability. The infrastructure is designed to manage large amounts of data resourcefully, making it the chosen database for businesses dealing with extensive loads of time-sequence data. It simplifies the administration of copious datasets via a process called 'chunking.' This partition technique slices large tables into smaller ones for easy handling, ensuring smooth operations irrespective of continuously growing data.
Further, TimescaleDB delivers excellent query performance. With advanced indexing methods and query fine-tuning, it ensures quick and efficient data access. Organizations conducting detailed inspections on time-sequence data will find this feature handy.
End-to-End SQL Accommodation
Unlike many other time-sequence databases, TimescaleDB grants total SQL support, allowing the full use of SQL operations. This extensive SQL provision eases the handling of time-sequence data. As it is entirely SQL compliant, TimescaleDB smoothly synergizes with existing SQL-dependent procedures and applications, thereby reducing integration complications.
Cutting-edge Data Minimization
TimescaleDB employs modern data reduction mechanisms to decrease the storage demand for the time-sequence data kept. Businesses aiming to save large quantities of time-sequence data for prolonged periods will find this feature advantageous. This option allows customization to meet user-specific requirements.
Automatic Data Retention
TimescaleDB comes with automatic data retention rules, giving an automated control of data lifespan. These rules can be configured to automatically discard outdated data, saving storage space and upgrading system efficiency.
Dependability and Openness
As a product of PostgreSQL, TimescaleDB enjoys the proven dependability and openness of its predecessor. Thus, it remains a trustable choice for enterprises intolerant to unplanned outages or data losses.
Adaptability
TimescaleDB provides a wide array of modification options, letting users create custom operations, data models, and functions. This adaptability places it as a versatile solution tailored to your specific needs.
In conclusion, TimescaleDB stands out from the multitude of time-sequence databases due to its scalable infrastructure, full SQL support, innovative data reduction, built-in data retention rules, commendable accessibility, and adaptable framework. The following discussion compares the data models of Prometheus and TimescaleDB to give a comprehensive insight into their time-sequence data handling techniques.
Understanding The Data Model: Prometheus vs TimescaleDB
When diving into the realm of chronological databases, the way data is classified, stored, and fetched is crucial. This principle is exemplified in a side-by-side evaluation of Prometheus and TimescaleDB. Both systems exemplify distinct data frameworks that reveal their individual merits and potential drawbacks.
Prometheus: A Brush with the Data Blueprint
Prometheus employs a multi-layered strategy in handling chronological data. It uses identifiers, known as metric names and labels (key-value pairs) to categorize the data effectively and robustly. It combines the general scope covered by the metric name and the precision of labels to zero in on specific datasets.
Consider this rudimentary representation of Prometheus handling chronological data:
In this illustration, net_req_cumulative is the sweeping category known as the metric name, while {method_type="POST", gateway="/notifications"} are the specific identifiers or labels. The cardinality of this model is great. However, handling massive unique timestamps could prove challenging and may affect Prometheus's efficacy and range.
TimescaleDB: The Art of Data Mapping
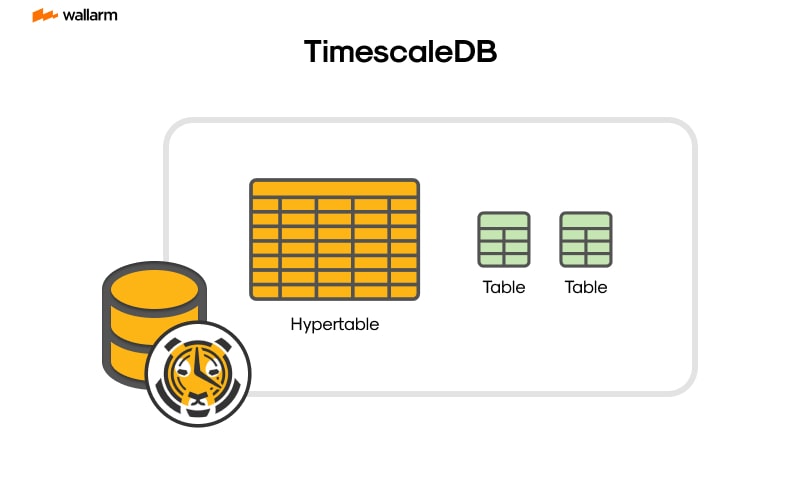
Conversely, TimescaleDB, grounded on PostgreSQL, employs a more conventional tabular data scheme. Here, datasets are arranged in tables composed of rows and columns. An interesting innovation in TimescaleDB is the introduction of hypertables meant for dealing with chronological data.
In a TimescaleDB setup, a hypertable mirrors a standard table but is optimized for timestamp data. The allocations are divided into parts, each indicative of a unique time span.
Consider this basic portrayal of TimescaleDB staging chronological data:
In this instance, weather_info is a hypertable with moment, locale, temp, and moistness denoting columns. The function develop_hypertable morphs the standard table into a hypertable.
The model used by TimescaleDB might not be as proficient as Prometheus while dealing with datasets of high individuality. However, its SQL-based organization and the introduction of hypertables make it user-friendly and efficient, especially for those already accustomed to handling relational databases.
Data Frameworks: Weighing Prometheus against TimescaleDB
Summarily, Prometheus and TimescaleDB apply unique data frameworks tailored for different uses. The multi-layered data model of Prometheus lends itself to extensive queries and calculations, making it a stronger choice for these tasks. Nonetheless, TimescaleDB’s conventional table-based design and the proficiency of hypertables make it a preferred option for dealing with high individual timeline data and for those who prefer working with SQL.
Prometheus: How It Deals with Time-Series Data
Prometheus has carved a niche for itself in the universe of free-to-use solutions, chiefly recognized for its potent monitoring and alert capabilities vital for administrative undertakings. It's laudable, specifically for handling time-series data and showcasing remarkable resilience, capable of healing even after catastrophic infrastructure failures.
The Mastery of Dual-Layered Data Arrangement
What sets Prometheus apart is its masterful two-fold data structure. This unconventional architecture utilizes identifiers for time-series data, constructed from two elements - a metric name and tags. Cumulatively, these identifiers add more dimensions to metrics, allowing users to classify data according to specific parameters, like differentiating production data from test data.
Take, for example, the duration of an HTTP request's latency, represented as:
In this context, http_request_duration_seconds serves as the assigned metric name, and method and handler act as tags, with their respective values.
Metric Compilation: The Genius of the Pull Method
Prometheus boldly diverges from the conventional push model, typically used by most monitoring tools, in favor of a continuous pull method to collect metrics. This innovation eradicates the need for apps to maintain queues or buffers, thus eliminating the risk of data loss during transmission.
Its reliability is also evident. If a system fails to expose its metrics, Prometheus quickly identifies such time-series as stale and sets off an alert. A substantial improvement from the push model where data could disappear following a system crash, bolstering Prometheus’ superiority in ensuring data reliability.
The Reasoning Behind Autonomous Time-series Data Storage
Prometheus takes pride in autonomous time-series data storage, meaning no reliance on external distributed storage systems. This strategy, reflecting its fundamental philosophy of steadfast reliability, stores data in a disk format explicitly designed for resource conservation.
Typical Prometheus architecture inherently collects and retains data, with its construct designed to maintain stability and reliability even while managing several instances on distributed systems. Although this secures against system crashes and smoothens operations, it may limit the overall data storage capacity.
PromQL: Adaptable Data Dissection
Prometheus inaugurates PromQL, a malleable query language adeptly customized to manage the multiple complexities endemic in time-series data. PromQL can handle a wide variety of inquiries, including:
- Single moment in time vector selectors
- Interval vector selectors
- Scalar functions and arithmetic computations
- Data consolidation maneuvers
Here's an illustration of a PromQL query, which calculates the 95th percentile of HTTP request durations during the last hour:
In conclusion, Prometheus reimagines familiar toolkits with its phenomenal attributes, such as a multi-faceted data arrangement, continuous pull protocol for metric assembly, self-sustaining data storage, and versatile query language. These aspects combine simplicity with ironclad reliability, reinforcing Prometheus as an optimal choice for the control and monitoring of time-series data.
TimescaleDB: Its Approach to Time-Series Data
TimescaleDB stands as a trendsetting, publicly accessible tool that's been exclusively devised to decode the intricacies of managing time-series data by implementing a broad-spectrum plan. This tool's core is reinforced by PostgreSQL, with TimescaleDB leveraging this robust groundwork while ushering in nuanced enhancements tailored to the needs of time-series data navigation.
TimescaleDB's Inventive Structural Blueprint
TimescaleDB deftly intertwines the merits of structured and unstructured data blueprints, generating a potent method for governing data. The tool infuses the robust relational features of PostgreSQL, enabling the execution of convoluted queries and transactions. Simultaneously, it bolsters this set-up with the introduction of hypertables, a novel function engineered to partition data into bite-sized, manageable chunks - a characteristic typically seen in colossal data governance within unstructured databases.
Hypertables sit at the heart of TimescaleDB's architectural make-up. They operate as an augmented version of PostgreSQL tables that are ordered as per the timelines and geographical specifics. TimescaleDB takes this organization under its wing, leading to an indistinguishable interaction experience between a hypertable and a traditional table. As a result, SQL queries can smoothly sail on hypertables as if on regular PostgreSQL tables.
Governing Vastly Varied Data
Navigating databases brimming with time-series data often leads to challenges in controlling data with high-cardinality--datasets teeming with a myriad of unique entities such as distinct user IDs or IP addresses. TimescaleDB proficiently steps in to resolve this conundrum by leveraging hypertables to logically slice data across multiple dimensions, successfully bypassing the typical hurdles faced while directing high-cardinality data in ordinary time-series databases.
Time-Series Data Supervision
TimescaleDB employs SQL - a universally recognized coding language - for data extraction. This allows coders to draw on their pre-existing knowledge of SQL to mingle with the database. With TimescaleDB's prowess reinforced by PostgreSQL, developers can access an expanse of SQL functions including JOINS, sub-queries, and window functions.
In addition to the conventional SQL capabilities, TimescaleDB provides features tailored for time-series data. An instance of this is the time_bucket() function that arranges data into time-sensitive clusters, thereby supporting data aggregation.
The SQL command depicted above categorizes data from the 'metrics' table into five-minute slots, determining the average value for each associated timeframe.
Lifecycle Controls and Storage Needs Reduction For Data
Armed with necessary functions for dictating data lifecycle and diminishing storage prerequisites, TimescaleDB facilitates the configuration of rules to automatically eliminate data under specified conditions - a feature pivotal in optimizing disc space usage. Moreover, the integrated data compression attribute significantly abates storage necessities.
In conclusion, TimescaleDB proficiently coalesces the virtues of both structured and unstructured databases. By leveraging the potency and versatility offered by SQL and PostgreSQL, and imbibing tailored features for efficient time-series data management, it presents an unrivaled choice for analyzing high-cardinality data, constructing complex queries, or directing disc space.
Comparison: Query Language in Prometheus and TimescaleDB
When it comes to time-series databases, the query language used is a critical factor that can significantly influence the performance, ease of use, and flexibility of the system. In this chapter, we will delve into the query languages used by Prometheus and TimescaleDB, namely PromQL and SQL respectively, and compare their features, syntax, and capabilities.
PromQL: The Query Language of Prometheus
PromQL, or Prometheus Query Language, is a functional query language specifically designed for Prometheus. It allows users to select and aggregate time-series data in real-time. The language is built around the concept of instant vectors, which are sets of time-series data at a single point in time, and range vectors, which represent a range of time.
PromQL's syntax is quite unique and may require some time to get used to, especially for those familiar with SQL. However, once mastered, it offers powerful data manipulation capabilities. Here's an example of a PromQL query:
This query retrieves the total number of HTTP GET requests in the last 5 minutes. The {method="GET"} part is a label matcher, which filters the time-series based on labels.
SQL: The Query Language of TimescaleDB
TimescaleDB, on the other hand, uses SQL (Structured Query Language) as its query language. SQL is a well-established, widely-used language for managing and manipulating relational databases. Since TimescaleDB is an extension of PostgreSQL, it inherits the full power and flexibility of SQL.
SQL's syntax is more familiar to most users, making TimescaleDB easier to adopt for those with a background in SQL. Here's an equivalent query in SQL on TimescaleDB:
This query does the same thing as the previous PromQL query, but in SQL syntax. The WHERE clause is used for filtering, similar to label matchers in PromQL.
Comparing PromQL and SQL
Now, let's compare PromQL and SQL in terms of their features and capabilities.
- Syntax and Learning Curve: SQL is a more familiar language to most users, making TimescaleDB easier to adopt for those with a background in SQL. PromQL, on the other hand, has a unique syntax that may require some time to learn.
- Data Manipulation: Both languages offer powerful data manipulation capabilities. However, SQL has a broader set of functions and operators, thanks to its long history and wide usage.
- Aggregation: Both PromQL and SQL support various aggregation functions like sum, avg, min, max, etc. However, PromQL also supports aggregation over time, which is a unique feature not commonly found in SQL.
- Label-Based Filtering: PromQL supports label-based filtering, which is a powerful feature for time-series data. SQL, on the other hand, relies on traditional WHERE clauses for filtering.
- Subqueries: SQL supports subqueries, which can be used to create complex queries. PromQL also supports subqueries, but they are limited to certain use cases.
In conclusion, both PromQL and SQL have their strengths and weaknesses. The choice between them largely depends on your specific use case, familiarity with the language, and the complexity of the queries you need to run.
Prometheus and TimescaleDB: Analyzing Their Storage Designs
As we delve into the realm of time-stamped data management, two critical elements come to the fore: performance-driving storage construction and the corresponding database frameworks. The focus here is to throw light on the storage infrastructures ingrained into two database powerhouses - Prometheus and TimescaleDB, unmasking their distinguishing merits and possible challenges.
Prometheus: Harnessing Speed with Streamlined Storage Design
At the heart of Prometheus lies a proprietary storage blueprint solely designed to facilitate swift, on-demand access to time-sequenced data—a feature that's propelling its popularity. It incorporates a unique approach that strategically arranges time-sequenced data across memory and communal hard disk in a custom-made format for augmented efficiency.
Stepping into the way, Prometheus works, the time-stamped data are organized into two-hour segments called blocks. Further, each block is divided into mini-sections, each earmarking a sequence of sampled data for a single time-sequenced series. This dynamic arrangement enables Prometheus to condense data optimally, marking down storage needs.
Coming to data protection, Prometheus employs a write-ahead log (WAL), a safeguarding mechanism for newer samples due to be hard-disk-written, thereby maintaining data persistence. The WAL backs up the series and the samples currently seated in the memory, delivering a fail-safe against data disappearance during system failures.
Here's a snapshot of Prometheus' storage schematic:
TimescaleDB: Navigating the PostgreSQL Landscape
In contrast to Prometheus, TimescaleDB is engineered as a performance-enhancing extension of PostgreSQL, extracting the maximum from this tried-and-tested storage powerhouse. Its storage blueprint is refashioned to streamline time-stamped data handling, while keeping intact the boons of a relational database.
An innovation from TimescaleDB, the 'hypertables' comprise several compact tables (known as chunks), partitioned by time and optionally by additional 'space' parameters. Each separate chunk relates to a distinct time window and nestles the actual data. This architecture allows TimescaleDB to efficiently coordinate heavy data processing.
On the same page as PostgreSQL, TimescaleDB maintains a transaction log - an important assistant to affirm data coherence and persistence. Furthermore, it permits the full spectrum of SQL operations, paving the way to exploit varied indexing strategies, data classes, and available PostgreSQL functions.
Have a look at TimescaleDB's storage schematic:
Storage Face-off: Prometheus vs TimescaleDB
The storage blueprints of Prometheus and TimescaleDB are distinguished by unique features catering to diverse strengths and limitations. The layout of Prometheus is designed for high efficiency and compaction, targeting speedy data access, a requirement in systems that rely on quick data accessibility.
On the other hand, TimescaleDB dives into the 'hypertable' concept allowing for scalability and flexibility in storage. It adeptly channels the processing of massive data aggregates and packs the benefits of extensive relational databases. This makes it a favorite for sophisticated analytical scenarios.
This table below represents the fundamental traits of their storage design:
The ultimate preference between Prometheus and TimescaleDB would be influenced by specific needs. If your system calls for high-speed data input and immediate monitoring, Prometheus stands as the probable choice. But for intricate data analysis and managing voluminous datasets, TimescaleDB with its scalable and adjustable storage blueprint may be the superior alternative.
Scalability: How Does Prometheus Compare to TimescaleDB?
Assessing various database options for handling data dependent on time, it is crucial to consider the proficiency of the system in responding to escalating needs. This analysis will delve into the scalability aspects of two renowned alternatives, Prometheus and TimescaleDB, and delineate their respective pros and cons.
Prometheus: Analyzing Scalability Challenges and Solutions
Operating as a metrics gathering platform, Prometheus utilizes a pull-based approach, which presents distinct impediments when discussing scalability. This process of pull for every successive target overloads the system resources, inflating the CPU and memory requisites.
Fundamentally rooted in vertical scalability, Prometheus aims to amplify a single system node by combining additional resources, such as CPU, memory, and storage. This method, however, limits its modifiability when confronted with extensive scaling operations.
To alleviate the absence of inherent horizontal scalability, Prometheus adopts federation. By implementing federation, a Prometheus server can retrieve specific time-series data from another, shaping a hierarchical network of servers, each tackling unique sections of your business structure. Although this creates a pathway to horizontal expansion, the approach often proves complex and difficult to manage.
TimescaleDB: Structured for Growth
In contrast, the foundational design of TimescaleDB, influenced heavily by PostgreSQL, assigns high priority to scalability. Relying on the reliability of this robust relational database, TimescaleDB embraces all expandability benefits rooted in PostgreSQL.
TimescaleDB’s agility enables it to employ both vertical and horizontal scalability - indicating it can augment the potential of a single server or distribute tasks among several servers.
To facilitate horizontal scaling, TimescaleDB utilizes an automatic data “chunking” concept; this masterfully divides data into temporal units. This division can be spread over several servers, rendering TimescaleDB more competent to cope with large data quantities compared to Prometheus.
TimescaleDB further assimilates replication and high-availability attributes inherently, offering superior robustness for bulk operations.
Comparative Graph: Prometheus vs TimescaleDB
In Summation
Therefore, when comparing the scalability potential, TimescaleDB surpasses Prometheus. While TimescaleDB adopts both horizontality and verticality in scalability and intertwines high availability and replication functions, Prometheus primarily depends on vertical scalability. Prometheus does offer a horizontal scalability alternative through federation, but it is typically more intricate and lacks the proficiency typified by the scalability methods favored by TimescaleDB.
Monitoring with Prometheus: A Practical Example
Deploying a management system, such as Prometheus, substantially improves your oversight of time-series databases. A closer look at the distinctive qualities of Prometheus reveals the utility of its supervisory characteristics.
Initiating Prometheus for Supervision
The inauguration of Prometheus for supervisory roles necessitates the establishment of a suitable environment. This process involves procuring the Prometheus tool and tailoring its configuration. After readying the system, you should adjust its settings to procure information from particular sources using the 'prometheus.yml' modification document. Here's an elementary representation of what this file might contain:
This example demonstrates that Prometheus will extract information from the 'localhost:9090' objective regularly every 15 seconds, which is the standard port.
Inspecting Data Indicators with Prometheus
With Prometheus operational, your attention can shift to examining data indicators. Prometheus actively retrieves data from your systems using a pull approach for metrics aggregation.
This application can handle a variety of metrics, encompassing counters, gauges, histograms, and summaries. Each metrics category targets a specific data aspect, supplying a rich repository of data knowledge.
For example, a counter could indicate a singular, ascending numeric value - useful for monitoring server inquiries. Conversely, a gauge, signifying a variable single number value, can be crucial in maintaining system memory usage.
To illustrate this point, consider this server inquiry rate oversight using a counter:
In this script, the counter 'my_requests' increases each time a GET inquiry is directed to the '/' endpoint.
Data Display with Grafana
Although Prometheus excels in data collection and preservation, it is less proficient in data portrayal. Here, tools like Grafana shine. Grafana is a no-cost platform developed explicitly for data display, supervision, and analysis. It synergizes well with Prometheus, facilitating the design of adaptable dashboards to exhibit your Prometheus metrics.
To illustrate your Prometheus-collected data on Grafana, you'll first need to register Prometheus as a data source. Once that's accomplished, you can create a new dashboard and embed panels. These data panels reveal unique metrics or a mix of them, customizable through Grafana's robust query editor.
This Grafana inquiry displays the HTTP inquiry rate for the preceding five minutes:
This query in Grafana uses the 'rate()' function to determine the mean per-second rate of 'my_requests_total' in the previous five minutes.
In summary, taking advantage of Prometheus for supervision encompasses three primary stages – preparing the environment, metrics aggregation, and data illustration. Deploying Prometheus effectively unveils rewarding insights into your time-series data, boosting your decision-making process.
Utilizing TimescaleDB for Monitoring: A Case Study
In the landscape of databases dealing with sequential data, TimescaleDB has established itself as a robust solution, predominantly beneficial for monitoring functions. In this chapter, we will unfold a real-world case study demonstrating how TimescaleDB can be practically employed for monitoring operations, emphasising its exclusive features and functionalities.
The Scenario
Picturing a hypothetical situation, we have a tech enterprise, GenX Tech, looking for methods to supervise its network system. GenX Tech's network consists of hundreds of devices such as servers, routers, and switches, dispersed across various locations. The enterprise seeks a strong monitoring framework capable of managing large amounts of data and delivering instantaneous information.
The Implementation
GenX Tech chose TimescaleDB to meet its monitoring requirements. As the initiatory step, they installed TimescaleDB which, being an augmentation of PostgreSQL, was simple to put up and assimilate with the existing framework. They devoted a specific server to navigate the TimescaleDB instance.
Following installation, they moved onto tweaking the devices to funnel their data to TimescaleDB. They accomplished this by employing the SNMP (Simple Network Management Protocol), which is an established protocol for network supervision. Each apparatus was set up to dispatch SNMP notifications to the TimescaleDB server.
The collected data constituted various metrics such as the proportion of CPU usage, the quantity of memory consumed, the extent of network traffic, and the lifespan of each device. All this information was accommodated into TimescaleDB in the format of sequential data, with every data point linked to a timestamp.
The Monitoring Dashboard
With the abundant data influx into TimescaleDB, GenX Tech needed a means to illustrate this data. They opted for Grafana, a favoured tool for data representation known for its compatibility with TimescaleDB, which facilitated the generation of dashboards and diagrams.
Their monitoring dashboard was equipped with diagrams for each metric, enabling them to filter by apparatus and location. This provision empowered the GenX Tech team to supervise the state of their network system on a real-time basis and identify possible complications.
The Results
The use of TimescaleDB for monitoring operations turned out to be a commendable decision. The system handled the torrential flow of data from hundreds of apparatuses with no performance deficits. Grafana's dashboard facilitated instantaneous insights which enabled the GenX Tech team to tackle issues preemptively, thereby reducing system downtime and enhancing network productivity.
The Code
Here's a basic illustration of how data was inducted into TimescaleDB:
This is how it was extracted:
This case study is a testament to the potency and versatility of TimescaleDB for monitoring tasks. Considering its capability to process large magnitudes of sequential data and its alignment with representation tools like Grafana, it is an impeccable solution for enterprises akin to GenX Tech.
Prometheus vs TimescaleDB: A Performance Showdown
In the universe of databases used specifically for time-series data, the success of data control is greatly reliant upon the system's efficiency. This piece introduces an elaborate comparison between Prometheus and TimescaleDB, two dominant contenders in the industry of time-series knowledge archives.
Key Evaluation Aspects
When evaluating time-series data libraries, the main criteria include:
- Query Performance: The time consumed in running a data request and getting responses.
- Ingestion Pace: The rate at which details can be incorporated into the record storage.
- Data Compaction: The system's capability to condense digital information for storage optimization.
- Adaptability: The potential of the platform to manage growing data volume.
Let's evaluate Prometheus and TimescaleDB on these dimensions.
Query Performance
Prometheus prioritizes query rapidity in its design, using a multi-dimensional model that indexes time series data by metric and key/value identifiers. This system enables rapid data access, though intricate queries may decelerate the system.
Conversely, TimescaleDB uses SQL, a well-known language among developers, for its queries. It features complete SQL functionalities, including JOINs, sub-queries, and window functions. This contributes to query versatility and speed. However, the performance could fluctuate depending on SQL query intricacy.
Ingestion Pace
Prometheus' intake speed is satisfactory but not its primary capability. It accumulates data in blocks that each represent a two-hour window, which may cause minor delays in data availability.
TimescaleDB shines in the area of ingestion speed. It adopts a section-based storage model where each section corresponds to a time span. This ensures swift data intake, making TimescaleDB the right choice for workloads needing quick data inserts.
Data Compaction
Prometheus lacks native support for data condensation, which could inflate storage expenses over time, particularly in large-scale setups.
In contrast, TimescaleDB promotes innate compression, which can minimize disk space by nearly 90%. This can significantly diminish storage costs and boost query speed by reducing I/O processes.
Adaptability
Prometheus confronts certain challenges regarding scalability because it is primarily designed for single-node operations. Horizontal scalability is complicated and needs sophisticated federation systems.
But TimescaleDB, constructed on PostgreSQL, exhibits strong capabilities for horizontal and vertical scalability. It efficiently manages massive amounts of data over numerous nodes without degrading performance.
Key Evaluation Aspects Showdown: Prometheus vs TimescaleDB
In summary, while both Prometheus and TimescaleDB have robust and disparate performance characteristics, Prometheus is highly effective for swift, simple queries, whereas TimescaleDB outshines in ingestion speed, data condensation, and scalability. Deciding between the two should hinge on the specific performance prerequisites of the application involved.
Data Retention Policies in Prometheus and TimescaleDB
Keeping data secure and organized is an essential responsibility for any database system, a duty typically carried out under the mantle of data retention. This is especially significant in the universe of time-series databases, where enormous quantities of data flow continuously. Metrics monitoring systems such as Prometheus and TimescaleDB both handle data retention, but their methodologies diverge and present their own set of strengths and obstacles.
Limitation by Lifespan: The Case of Prometheus
Prometheus operates by coupling data retention with lifespan. It is primed to keep time-series data for a span of fifteen days as a standard setting. However, users can modify this lifespan according to the necessity of their operations. You can modify it using the flag '--storage.tsdb.retention.time' while Prometheus is booting.
Using the aforementioned command, Prometheus is tuned to keep the data for a period of 30 days. After reaching this benchmark, the earliest data is disposed of to maintain storage hygiene. This technique focuses on simplicity but lacks the ability to selectively preserve useful data beyond the set retention period.
Adaptive and Detailed Control: The Story of TimescaleDB
TimescaleDB, differing from Prometheus, provides a versatile and detailed control through its data lifecycle management feature, empowering users to tailor retention plans for diverse data categories.
In the realm of TimescaleDB, retention strategies revolve around hypertables. A hypertable is essentially a scalable table, spatially divided based on time and other potential dimensions. You control the lifespan of data within each hypertable individually.
The command above establishes a seven-day retention rule for the 'conditions' hypertable. Added to this, TimescaleDB also enhances its retention potency by integrating data compression, an approach that dramatically shrinks the demand for storage, enabling large datasets' maintenance without straining storage.
Comparative Analysis: Rethinking Data Retention with Prometheus vs TimescaleDB
While Prometheus provides a user-friendly data retention control mechanism by confining the data's lifespan, TimescaleDB steps ahead with adaptive retention control and increased storage efficiency, facilitating a more nuanced approach. The decision between the two is dictated by the distinct data retention requirements and available storage resources.
Support and Community: Comparing Prometheus and TimescaleDB
Open-source solutions, such as Prometheus and TimescaleDB, thrive on collective participation and community aid. Detailed insights about the active engagement and support framework of these time-series databases, as well as their pros and cons, are examined.
Participant Contributions and Synergies
Located under the umbrella of the Cloud Native Computing Foundation (CNCF), Prometheus receives significant user participation due to its vast and diverse network of contributors. Over 30,000 stars and well above 4,000 forks on its GitHub platform bear testimony to the active involvement and frequent inputs from the user community. Contributions from users, paired with a wealth of digital guides, utilities, and learning resources, lower the threshold for novices.
On the other hand, TimescaleDB has a smaller yet steadily increasing user following. No less significant, the TimescaleDB GitHub platform graced by more than 10,000 stars and in excess of 500 forks, signals a healthy engagement from the users. Regular updates to the repository by the TimescaleDB community, coupled with a blog that routinely updates with intuitive how-tos, real-world examples, and latest news, underscore it further.
Assistance Channels
Both Prometheus and TimescaleDB offer a plethora of support channels. Prometheus users can find help through their email system, designated IRC channel, and members-only Slack. Also, face-to-face meetups around the globe enable Prometheus users to create a network of understandings.
TimescaleDB, in comparison, offers support through avenues like community Slack, submissions of issues on GitHub, and queries on Stack Overflow. For corporate users, TimescaleDB has laid out a dedicated support portal. Interactive online events and meetups are also hosted by them to boost user interaction.
Educational Resources
Prometheus's learning framework includes lessons from the basics to the advanced technology platforms. Digital video instructions, blog content, and academic articles ramp up the learning curve of Prometheus's users.
TimescaleDB's detailed documentation caters to all users ranging from beginners, with guides and API glossaries, to advanced users through in-depth tutorials. Valuable write-ups about various facets of TimescaleDB and time-series data form part of their routinely updated blog as well.
Business Support
Additional professional assistance is provided by both Prometheus and TimescaleDB for corporations. Many companies extend expert services including consulting, training, and bespoke development revolving around Prometheus.
Contrastingly, TimescaleDB has introduced TimescaleDB Enterprise, a paid iteration of their product with advanced features such as automated data lifecycle management, prioritized support, and robust security mechanisms, aiming to provide a cohesive experience over its open-source version.
In summary, the vibrant communities of Prometheus and TimescaleDB offer a host of support mechanisms. While Prometheus boasts a larger community base, TimescaleDB has a fast-paced growth curve and provides a paid version with superior capabilities and assistance. The ultimate choice between these two best boils down to your specific requirements and inclinations.
Making the Right Choice: Considerations When Choosing Between Prometheus and TimescaleDB
Deciding on whether to utilize Prometheus surveillance software or TimescaleDB as your time-series database system warrants a detailed comparison of the perks, downsides, and optimal use cases for each system.
Breaking Down Your Needs
Commence by dissecting your operational setting and necessities. Contemplate the inherent character of your data, its projected size, and the complexity of your operational assignments.
Prometheus behaves like an intuitive monitoring tool adept at extracting and scrutinizing data measures from a plethora of origins. Additionally, it offers immediate alert options. On the contrary, TimescaleDB behaves like a comprehensive time-oriented database. It accommodates an array of data types and provides remarkable flexibility in handling intricate tasks.
Judging System Capacity
The effectiveness of both solutions is inherently tied to their data storage practices. Prometheus confines itself to memory and local disk storage, accelerating data input and task implementation speed. It falters, however, when faced with large datasets as it struggles with handling voluminous data.
Conversely, TimescaleDB is anchored in PostgreSQL. By harnessing PostgreSQL's robust storage framework, TimescaleDB ensures efficient size control and scalability. Nonetheless, this configuration may cause slower task response times.
Apprehending Scalability
In situations where you foresee a data influx, scaling potential is pivotal. Due to its dependency on local storage, Prometheus may struggle when collecting extensive data. Yet, TimescaleDB excels in such scenarios, being in a favorable position when dealing with petabytes of data.
As one may predict, TimescaleDB dominates in scalability, adeptly managing large datasets through its capacity to distribute data across various nodes, thereby boosting both performance and storage capability.
Weighing Usability
The ease of use and the learning curve for each system are also pivotal factors to consider. Although Prometheus and TimescaleDB employ their proprietary query languages - PromQL for Prometheus and SQL for TimescaleDB - you might lean towards TimescaleDB if you're proficient with SQL. However, for metric data manipulation or advanced computations, PromQL offers a more streamlined user interface.
Inspecting Support and Community Assistance
Finally, gauge the community support and resources available. Even though both systems lay claim to vigorous online communities and exhaustive documentation, Prometheus, being a part of the Cloud Native Computing Foundation, might have the upper hand regarding assistance and frequent updates.
In summary, opting for Prometheus or TimescaleDB fundamentally hinges on your particular demands and circumstances. A methodical dissection of your requirements, system capacity, scalability potential, user-experience comparison, and community support assessment will empower you to make a knowledge-based decision that aligns with your goals.
Pros and Cons: Prometheus vs TimescaleDB
When it comes to databases designed especially to manage data in series, two names consistently come up: Prometheus and TimescaleDB. The peculiarities of each can potentially serve diverse requirements effectively. In this piece, we'll explore the features that differentiate these databases.
Detailing Prometheus
- Effortless Architecture: Prometheus stands out due to its uncluttered design. This is particularly beneficial for small teams or independent developers seeking an uncomplicated and smooth operation.
- Customized Query Language: Through PromQL, a specialized query language, Prometheus offers its users a wide variety of data interpretation options.
- Inbuilt Alert System: Prometheus comes equipped with an automated alert function that sends default alerts when specific limits are exceeded.
- Refined Data Configuration: Unlike the classic relational models, Prometheus adopts a more complex approach to data configuration.
- Optimized Management of Sequential Data: Built specifically to monitor sequential data, Prometheus handles large quantities of data exceedingly well.
Restrictions of Prometheus
- Limitations in Scalability: Prometheus has its limitations when it comes to horizontal scalability, which could create challenges for extensive systems.
- Lack of Built-In Backup Feature: The nonexistence of a built-in feature for data replication could potentially affect system reliability in case of service interruptions.
- Question Marks Over Long-Term Data Storage: There are doubts about Prometheus's capacity to store data for prolonged periods.
Benefits of TimescaleDB
- Enhanced Scalability: When discussing horizontal scalability, TimescaleDB takes the lead. This makes it an appropriate choice for demanding applications and significant data handling.
- Perfect Harmony with SQL: TimescaleDB perfectly integrates with the SQL language, improving its compatibility with existing tools and systems.
- Long-Term Data Retention: TimescaleDB excels in storing data for extended durations, a key requirement when it comes to preserving historical data.
- Born out of PostgreSQL: As it is derived from the reliable and endorsed PostgreSQL open-source database, TimescaleDB inherits many beneficial attributes.
Constraints of TimescaleDB
- Complex Initial Setup: Initial setup can be somewhat challenging especially for those unfamiliar with PostgreSQL.
- Struggling with Real-Time Data Management: TimescaleDB can't compete with Prometheus when it comes to processing real-time data.
- Absence of Instant Alert Mechanism: The absence of an automated alert system means users may need to build their own.
Conclusively, the choice between Prometheus and TimescaleDB should be dictated by specific requirements. If you value ease of operations, prompt data processing, and automatic alerts, choose Prometheus. But, for seamless SQL integration, superior scalability, and long-duration data preservation, TimescaleDB holds the edge.
Prometheus and TimescaleDB: Which Suits Your Business Needs Best?
In the vast world of time-series databases, Prometheus and TimescaleDB stand out as unique offering systems with differing functionalities catering to distinct company requisites. This section shines a spotlight on each of these databases' respective features and aids in determining the best fit for your enterprise.
Understanding Specific Requirements
Prior to commencing a detailed exploration of each system, take the necessary steps to identify your company's precise needs. Does your company thrive better with a database adept in immediate monitoring and alarms? Conversely, it might be crucial to have a system apt at processing mass data traffic and managing intricate requests. Having a clear perspective of your requirements will guide you to the ideal choice.
Prometheus, armed with its superior surveillance features, is an optimal choice for businesses that seek immediate data and updates about their systems. On the flip side, TimescaleDB possesses strong request-processing skills and scalability factors, which makes it a favourite for businesses grappling with mass data traffic and intricate analytical operations.
Prometheus: Specialised in Instant Monitoring and Alarms
Prometheus enjoys a reputation for superiority in instant monitoring and alarm systems. Its structure has been meticulously designed to promote reliability, enabling you to trustfully rely on it during infrastructure breakdowns. This makes it a reliable ally for businesses that need constant vigilance on their systems and immediate incidents response.
Prometheus utilizes a pull-based model to gather metrics, ensuring your surveillance system setup and upkeep is streamlined. Additionally, it incorporates an efficient alarm system that alerts you about any issue instantly.
However, Prometheus might prove to be inadequate if your business operations involve dealing with complex requests or managing mass data traffic. If heavy data analytics or long-term data storage is a critical part of your business, Prometheus might disappoint.
TimescaleDB: Advanced Request Management and Scalability
On the contrary, TimescaleDB thrives at managing intricate requests and processing mass data traffic. It has been engineered atop PostgreSQL, thereby receiving powerful request management abilities and enhancing it with specific time-series features.
TimescaleDB employs a unique chunking technology to amass time-series data, enabling it to efficiently process vast data traffic. Additionally, its full SQL support simplifies complex analytic operations.
However, TimescaleDB lacks built-in surveillance features or alarm systems. Businesses that require immediate monitoring might need to pair TimescaleDB with other tools.
Finding the Perfect Fit
The decision between Prometheus and TimescaleDB must hinge on your precise business requirements. If instant monitoring and alarms are a business essential, Prometheus might be the preferred option. Conversely, if the management of intricate requests and high-volume data traffic is your priority, TimescaleDB might emerge victorious.
Remember, when it comes to time-series databases, a one-size-fits-all solution doesn't exist. The optimal choice is dictated by your personalised needs and operating circumstances.
Conclusions: Prometheus or TimescaleDB, The Ultimate Battle of Time-Series Databases
Exploring the realm of time-series data management, two leaders surface: Prometheus and TimescaleDB. These two are distinct yet complementary components in the broader picture, each proficiently fitting specific business scenarios with their distinguishing features.
Their Unique Attributes
Prometheus thrives on a pull-based schema and was primarily designed for operational monitoring. It's like being in a command center where it's vital to witness every activity. Prometheus excels in taking quick snapshots of your systems and applications, drawing valuable insights. Using its robust query language, PromQL, it uncovers every data layer, making it a powerful asset for alert broadcasts and visualizing data patterns.
Conversely, TimescaleDB employs an SQL-based time-series database model, which is underpinned by PostgreSQL. It's like breathing new life into an aged building, maintaining the sturdy foundation but infusing modern designs and facilities. TimescaleDB shows its strength when there's a necessity to warehouse and undertake rigorous analysis of vast quantities of historical data. It extends complete SQL support, thereby offering a comfortable space for developers and merges seamlessly with existing PostgreSQL tools and environments.
Reviewing Their Performances
Both Prometheus and TimescaleDB have demonstrated superior performance attributes. Prometheus stands out due to its compact data model, compressed data storage technique, and speedy query execution for real-time monitoring. But it struggles when grappling with vast datasets and long-term data preservation due to its single-node architecture dependency.
However, TimescaleDB, with its scalable multi-node setup, proves its mettle by easily managing significantly large datasets and offering data retention over an extended timeframe. The performance stays steady even with data growth, thanks to automatic time series data partitioning across various storage platforms and nodes.
Focusing on Data Preservation and Scalability
TimescaleDB is the unrivaled choice for handling long-term data storage and scalability issues. Where Prometheus stumbles due to limited storage capacity of a single node and lack of natural scaling out ability, TimescaleDB shines. Generally, one must resort to manually partitioning data or depend on external solutions to overcome Prometheus’s limitations.
In stark contrast, TimescaleDB supports multi-node scaling and provides flexible data retention policies. It allows for seamless database scaling to accommodate increased data or boost query performance. Furthermore, it allows for data conservation policies at distinct table levels, allowing for managing varying data types for individual durations.
Addressing Community Support
Both Prometheus and TimescaleDB have cultivated vibrant and active user communities. While Prometheus benefits from its association with the Cloud Native Computing Foundation and a wide user base, TimescaleDB, despite being relatively new, has quickly garnered attention and a growing community of users and contributors.
Conclusion
Ultimately, whether you opt for Prometheus or TimescaleDB depends strictly on your specific use case. Go for Prometheus if your system requires robust alerting and data visualization capabilities. Choose TimescaleDB if you seek a scalable time-series database that can aptly store and analyze sizeable historical data.
Note that these two are not rivals but partners in the business scenario. Many businesses leverage both - employing Prometheus for real-time monitoring and using TimescaleDB for data analysis and preservation over the long term, harnessing the strengths of each system. The real challenge lies not in picking one over the other, but in finding the most effective mixture that caters to your business requirements.
FAQ
Subscribe for the latest news


.jpeg)